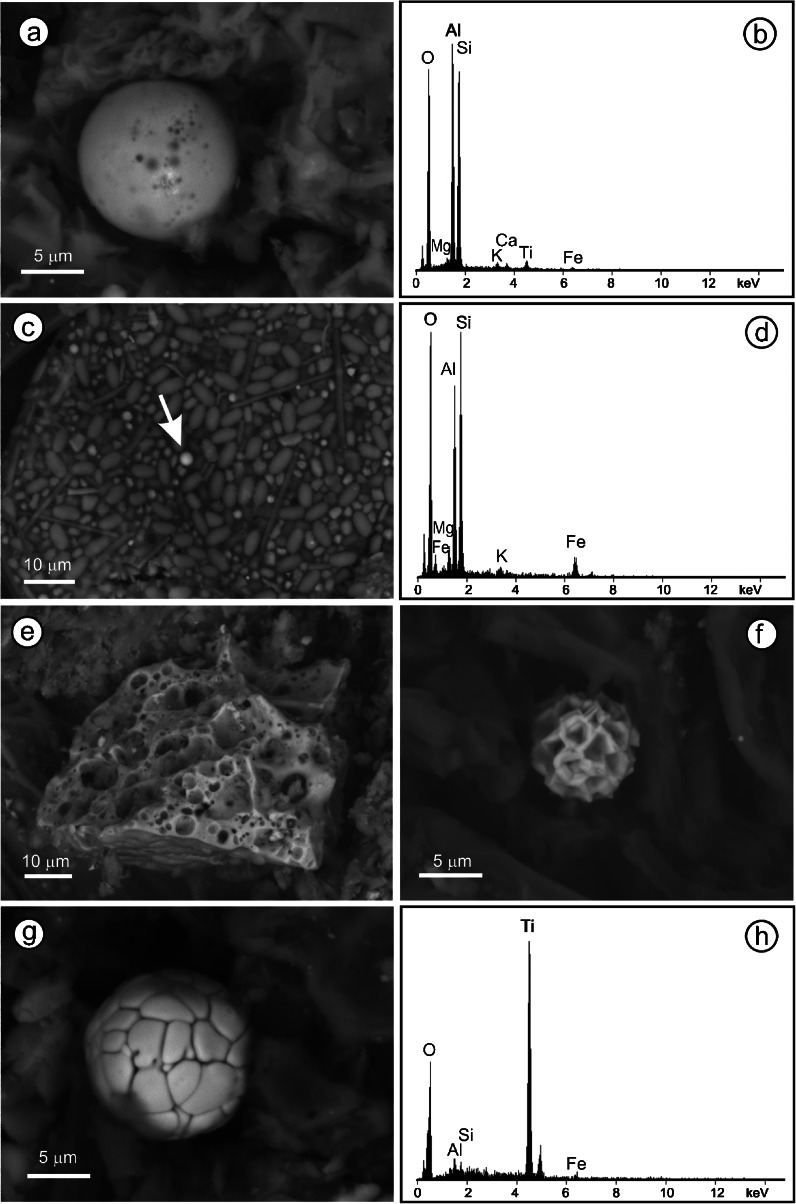
Fig. 3.
BSE images of anthropogenic particles. a Typical SAP and b the corresponding EDS spectra showing Ti enrichment in the particle, PM1, depth, 6–7.5 cm; c testate amoeba with incorporated spherical fly ash particle (indicated by arrow), BB1, 13–14 cm; d EDS analysis of the spherical particle in (c); e porous aluminosilicate aggregate, BM1, 15–16 cm; f spherical Fe oxide, PM, 9–10.5 cm; g spherical Ti oxide; and h the corresponding EDS analysis, BB2, 15–16 cm

