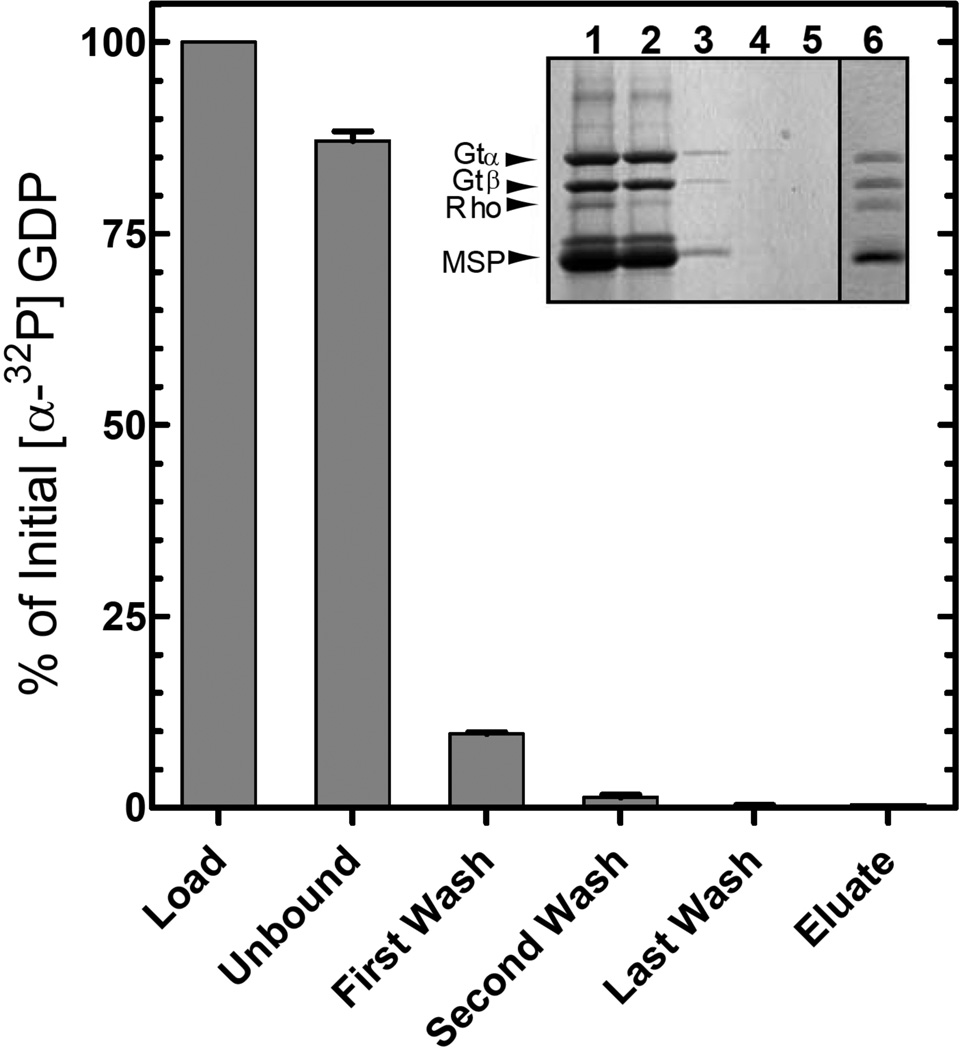
Figure 6.
Nucleotide release during formation of the R*/Gt complex. The activated complex was purified on 1D4-Sepharose as described in Figure 3B and Experimental Procedures using a Gt sample containing [α-32P]-GDP in the nucleotide-binding pocket. Radioactivity in the fractions was monitored by liquid scintillation counting. Values are expressed as a percent of the total [α-32P]-GDP in the loaded sample. Error bars represent standard deviation with n = 2. Inset, SDS-PAGE analysis of the steps in purification of the complex as visualized by Coomassie Blue staining. Lane 1, material applied to the 1D4-Sepharose column; lane 2, unbound material; lane 3, first wash; lane 4, second wash; lane 5, last wash; and lane 6, 1D4-peptide eluate.

