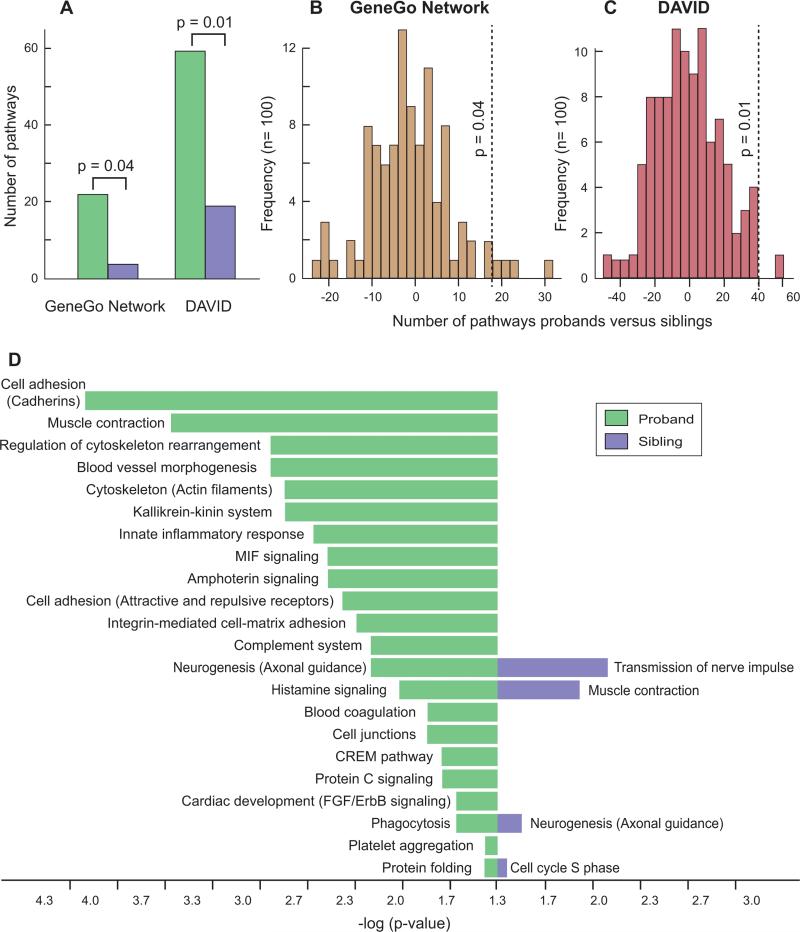
Figure 6. Pathway analysis of genes mapping within transmitted rare CNVs.
A) The number of pathways with a corrected p-value ≤0.05 identified in probands (green) and siblings (purple) by the programs Metacore (GeneGo Networks) and DAVID (level 4 terms). The input consisted of 1,516 RefSeq genes found only in transmitted rare CNVs in probands and the 1,357 RefSeq genes found only in transmitted rare CNVs in siblings; p-values are from B and C. B) Permutation analysis to assess significance of the difference between probands and siblings. The 2,873 genes identified in probands or siblings were divided randomly between probands and siblings in the same initial proportions. The lists were submitted to GeneGo Networks and the difference between the number of pathways in probands and siblings was recorded. This process was performed 100 times and the image shows the frequency of the results. Only 4 events showed a difference ≥18 (the difference seen in A, vertical dashed line) yielding a p-value of 0.04. C) Permutation analysis to calculate the significance value with DAVID (level 4 terms) using the same methods as in B. A single result was ≥40 (the difference seen in A, vertical dashed line) giving a p-value of 0.01. D) All pathways with a corrected p-value ≤0.05 identified by GeneGo Networks for probands (green) and siblings (purple). The length of the bar represents the significance value on a logarithmic scale.

