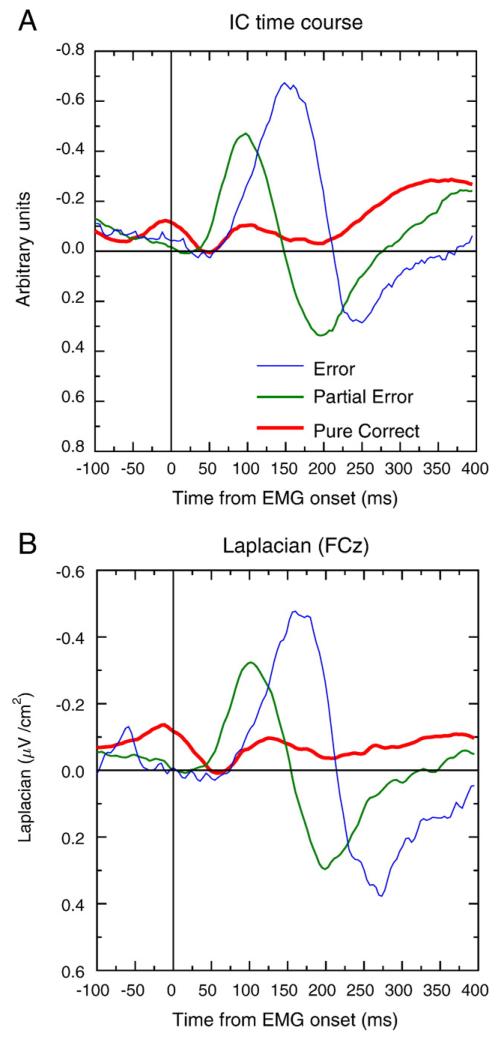
Fig. 4.
Grand average of the Ne_ICS time course (panel A) and of the Laplacian transformed data (panel B, electrode FCz), for the three categories of trials. The zero of time corresponds to EMG onset (see Fig. 1 for details). The ICA data present a clear negative activity just after EMG onset, for both the partial errors and the correct trials.

