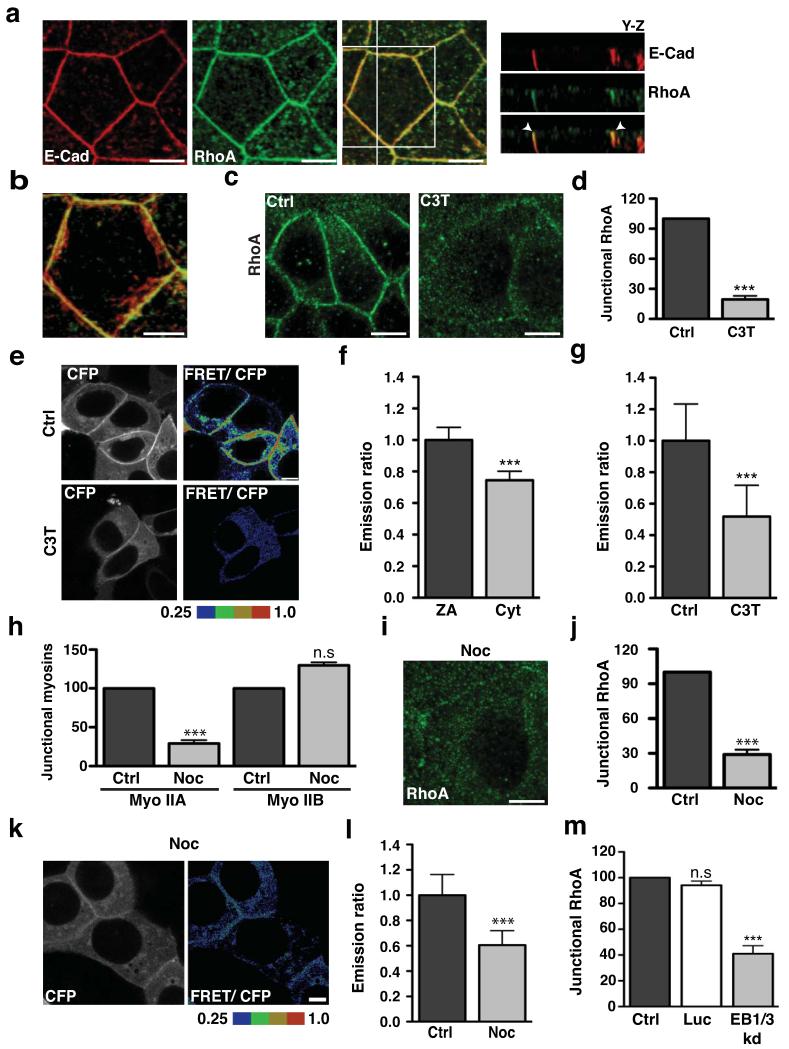
Figure 1. The zonula adherens is a microtubule-dependent Rho zone.
(a-b) Apical junctions in TCA-fixed MCF-7 monolayers immunostained for E-Cadherin (E-Cad, red) and RhoA (green) imaged by confocal microscopy. The distribution of proteins along the z-axis of cells is represented in y-z views (taken at the vertical line) (a) and the magnification (b) shows colocalisation of E-cadherin with RhoA at the ZA in a maximum intensity projection. Arrowheads indicate accumulation of E-cadherin and RhoA at the ZA (a).
(c-d) Confluent MCF-7 cells treated with either C3 Transferase (C3T; 0.25 μg/ml) or glycerol (vehicle, Ctrl) for one hour and then fixed and stained for RhoA. Representative confocal images were taken from the apical junctions (c) and fluorescence intensity at cell junctions was quantitated by linescan analysis (d). Data represent control-normalized means ± S.E.M. of data pooled from three individual experiments (n=30), ***P<0.0001; Student’s t-test.
(e-g) Confluent MCF-7 cells expressing a RhoA-FRET biosensor were treated as in c-d and imaged live using confocal microscopy. Images were acquired in the CFP and FRET channels and representative images (CFP and ratio of FRET/CFP) are shown (e). Average emission ratios were determined at the apical junctions and the cytoplasm of control cells as described in methods (f). To determine the effect of C3T on junctional RhoA activity, average emission ratios were quantitated at the apical junctions (g). Data represent junctional-(f) or control-normalized (g) means ± S.E.M. of data pooled from three individual experiments (n=26), ***P<0.0001; Student’s t-test.
(h) Confluent MCF-7 cells were treated with DMSO (Ctrl) or Nocodazole (100nM, 3h) and fluorescence intensity of myosin (Myo) IIA and IIB at cell junctions was quantitated by linescan analysis. Data represent control-normalized means ± S.E.M. of data pooled from three individual experiments (n=25), ***P<0.001; Student’s t-test.
(i-j) Control and Nocodazole-treated cells were fixed and stained for RhoA. Representative apical confocal images were taken (i) and junctional RhoA was quantitated by linescan analysis (j). Data represent control-normalized means ± S.E.M. of data pooled from three individual experiments (n=30), ***P<0.001; Student’s t-test.
(k-l) Confluent MCF-7 cells expressing a RhoA-FRET Biosensor were treated with Nocodazole (as in h) and imaged live using confocal microscopy. CFP and ratio of FRET/CFP representative images are shown (k) and average emission ratios were quantified at the apical junctions (l). Data represent control-normalized means ± S.E.M. of data pooled from three individual experiments (n=40), ***P<0.001; Student’s t-test.
(m) MCF-7 cells were transfected with pECFP-C1 (Ctrl) or with pSUPER constructs containing shRNAs against Luciferase (Luc) or EB1 + EB3 (EB1/3 kd) and fixed after 48 hours. Junctional RhoA in CFP-positive cells was quantitated by linescan analysis. Data represents control-normalized means ± S.E.M. of data pooled from three individual experiments (n=15), *** P<0.001; One way Anova, Dunnett’s post hoc test.
Scale bars: a,c,i 10μm; b,e,l 5 μm.

