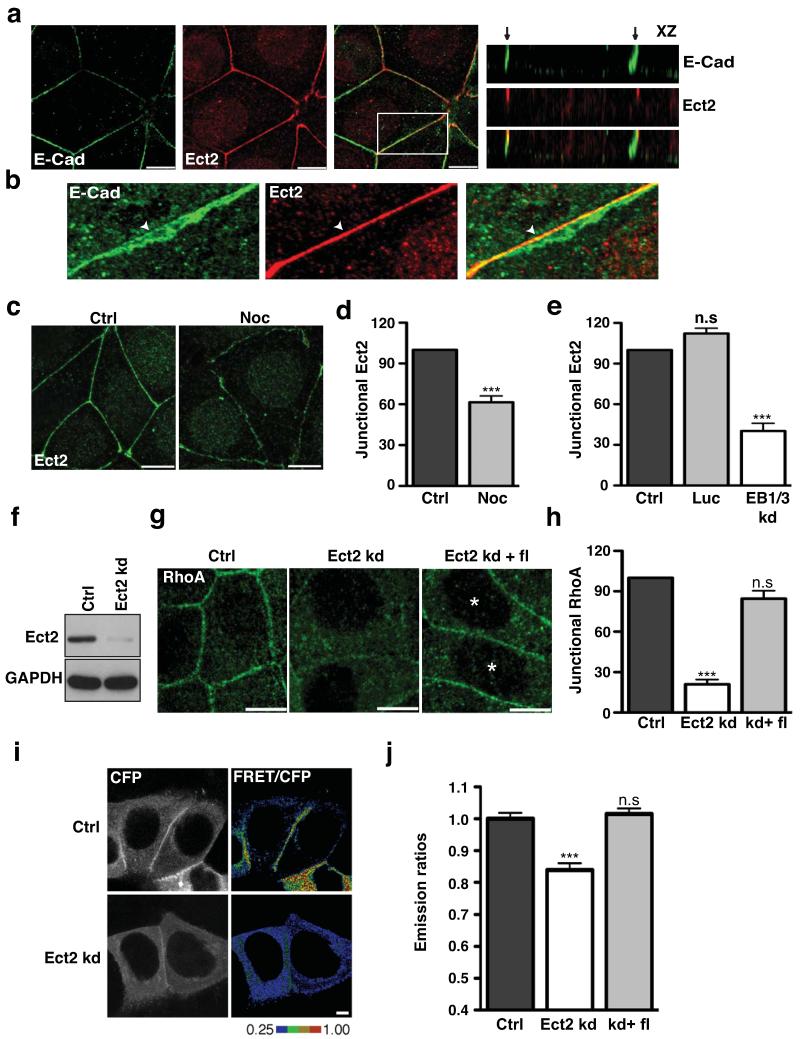
Figure 2. Ect2 is a junctional RhoA GEF.
(a-b) Confluent MCF-7 cells were fixed and immunostained for E-Cadherin (E-Cad, green) and Ect2 (red). Representative confocal images at the zonula adherens (a) and x-z views illustrating the distribution of proteins along the z axis of cells. Arrows indicate the apical tips of cell–cell contacts. (b) Magnification shows colocalisation of E-cadherin with Ect2 at the ZA in a maximum intensity projection. Arrowheads indicate accumulation of E-cadherin and Ect2 at the ZA.
(c-d) Confluent MCF-7 cells treated with or without Nocodazole (Noc and Ctrl) were fixed and stained for Ect2. Representative confocal images were taken from the apical junctions (c) and junctional Ect2 was quantitated by linescan analysis (d). Data represent control-normalized means ± S.E.M. of data pooled from three individual experiments (n=30), ***P<0.001; Student’s t-test.
(e) MCF-7 cells were transfected with pECFP-C1 (Ctrl) or with pSUPER constructs containing shRNAs against Luciferase (Luc) or EB1 + EB3 (EB1/3 kd). Junctional Ect2 in CFP-positive cells was quantified by linescan analysis; data represent control-normalized means ± S.E.M. of data pooled from three individual experiments (n=15), ***P<0.001; One way Anova, Dunnett’s post hoc test.
(f) Lysates from MCF-7 cells infected with lentivirus bearing an empty vector control (Ctrl) or an shRNA-directed against Ect2 (Ect2 kd) were immunoblotted for Ect2 and GAPDH (loading control).
(g-h) Rho immunofluorescence in control (Ctrl), Ect2 knockdown (Ect2 kd) cells, and Ect2 kd cells transiently expressing shRNA-resistant EGFP-Ect2 (Ect2kd + fl). Representative confocal images were taken from the apical junctions of cells (g) and junctional RhoA was quantitated using linescan analysis (h). Asterisks mark cells transfected with EGFP-Ect2. Data represent control-normalized means ± S.E.M. of data pooled from three individual experiments (n=15), ***P<0.001; One way Anova, Dunnett’s post hoc test.
(i-j) Control (Ctrl), Ect2 knockdown (Ect2 kd) and Ect2 kd cells expressing RNAi-resistant Ect2 (kd+fl) cells were transfected with a RhoA-FRET Biosensor and imaged live using confocal microscopy. Representative images of CFP and ratio of FRET/CFP are shown (i) and average emission ratios were quantified at the apical junctions (j). Data represent control-normalized means ± S.E.M. of data pooled from three individual experiments (n=43), ***P<0.001; Student’s t-test.
Scale bars: a,c,g 10 μm; i 5 μm.

