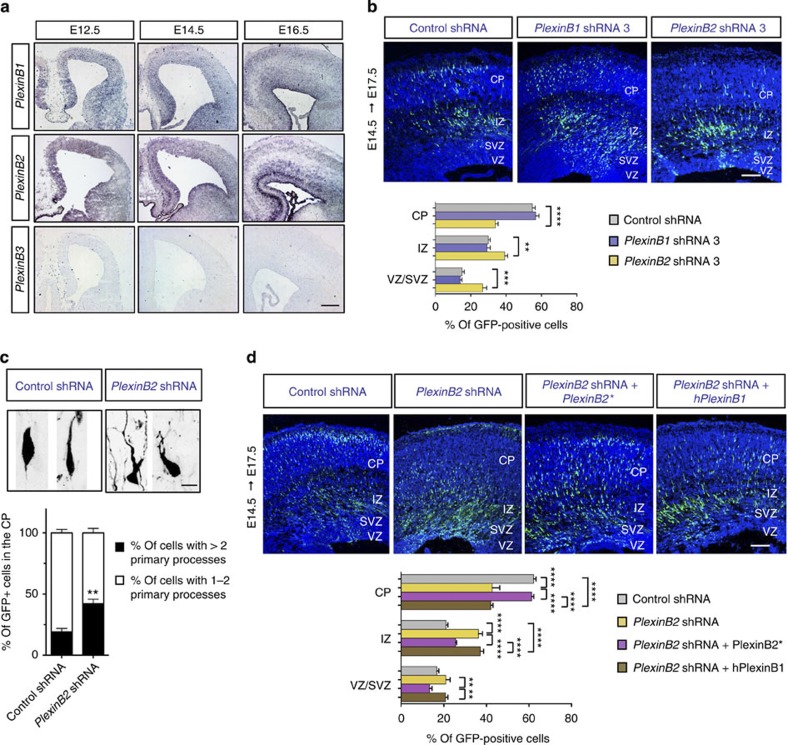
Figure 1. Plexin B2 regulates the migration and the morphology of cortical neurons.
(a) Distribution of Plexin B1, Plexin B2 and Plexin B3 transcripts in coronal sections from E12.5, E14.5 and E16.5 mouse brains. Scale bar, 250 μm. (b) Migration analysis of cortical neurons electroporated in utero with Plexin B1 or Plexin B2 shRNAs at E14.5 and analysed 3 days later. Most Plexin B2-silenced neurons failed to reach the upper layers of the cortex in comparison with Plexin B1 shRNA or control-treated neurons. TOTO-3 was used to label nuclei and subdivide the cortical wall into cortical plate (CP), IZ and subventricular zone/ventricular zone (SVZ/VZ). The quantification graph shows the distribution of GFP-positive cells in different zones of the cortex (VZ/SVZ, IZ and CP) in the different electroporation experiments. Data are presented as the mean±s.e.m. from six sections prepared from three embryos obtained from two or three litters. One-way ANOVA followed by the Bonferroni post-hoc test; **P<0.01, ***P<0.001, ****P<0.0001. Scale bar, 200 μm. (c) Morphology of electroporated cells in the CP. Many Plexin B2-silenced neurons displayed abnormal morphologies, characterized by a branch-leading process or supernumerary primary processes. Scale bar, 10 μm. Quantification graph shows the proportion of cells exhibiting more than two primary processes (in black); n>150 cells from three different brains. Student’s t-test; **P<0.01 compared with control. (d) The radial migration defect of PlexinB2-deficient neurons was rescued by overexpression of a shRNA-resistant version of Plexin B2 (Plexin B2*), but not by overexpression of human Plexin B1 (hPlexinB1). Mean±s.e.m. from six sections prepared from three different experiments; one-way ANOVA followed by the Bonferroni post hoc test; **P<0.01, ****P<0.0001. Scale bar: 200 μm.

