
Figure 4.
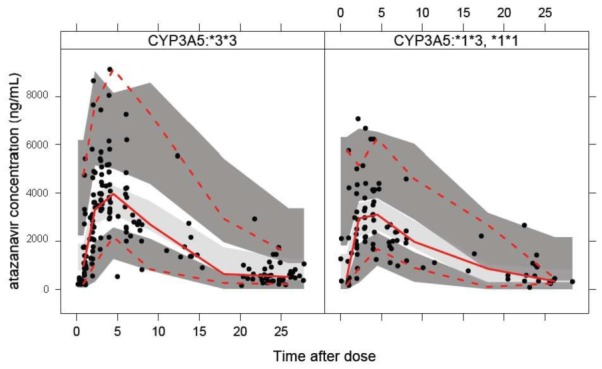
Visual predictive check for the final atazanavir model stratified for different CYP3A5 genotypes: homozygote *3*3 shown in the left panel and heterozygote *1*3 and homozygote *1*1 shown in the right panel. Red solid line indicates observed data median, red dotted lines are 95% observed percentiles, grey shaded area is the simulated median with uncertainty and dark grey shaded areas are simulated 95% percentiles with uncertainty.