
Figure 6.
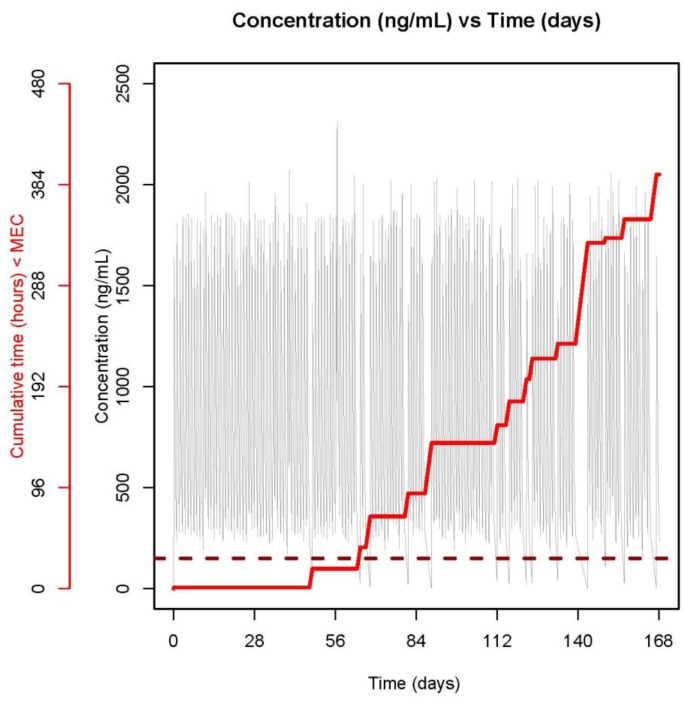
PK profile over 6 months derived based on individual parameter estimates and full dosing histories (grey line) for one patient with VL > 40 cp/mL at week 24. Cumulative time below MEC is shown with a red stair-case line. The target MEC of 150 ng/mL is shown with a dark red broken line.