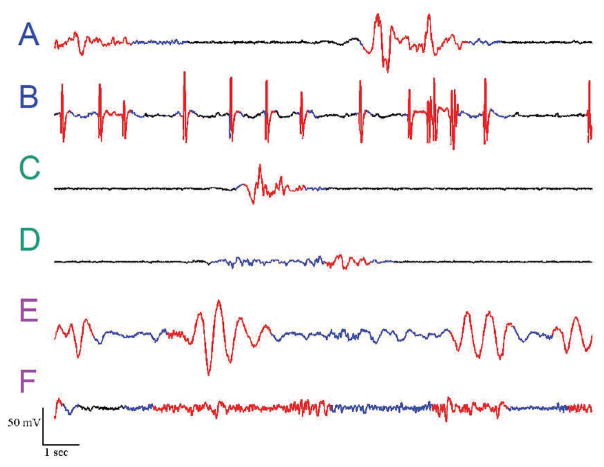
Fig. 4.
Examples of ICU burst suppression with automatic segmentation. Segmented bursts (i.e., nt = 0) are shown in red, while suppressions (i.e., nt = 1) are blue. (A,B) Patterns containing epileptiform spikes, (C,D) Patterns with distinct bursts and suppressions, (E,F) Patterns with less distinct bursts

