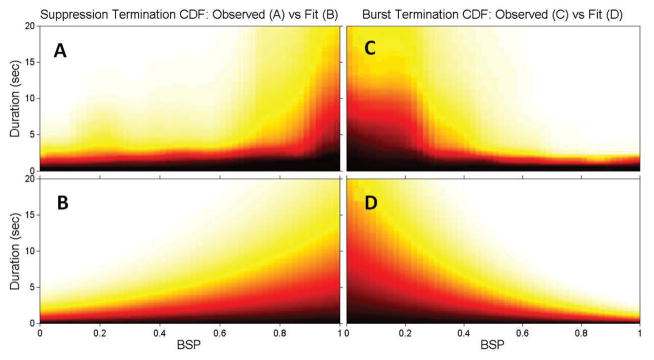
Fig. 6.

Empirical1 and fit switching probability functions vs. BSP for suppressions (A,B) and bursts (C,D). The fitted functions (B,D) closely match the empirical CDFs (A,C). White indicates values close to 1 (high probability of switching) whereas black indicates values close to 0 (low probability of switching).
