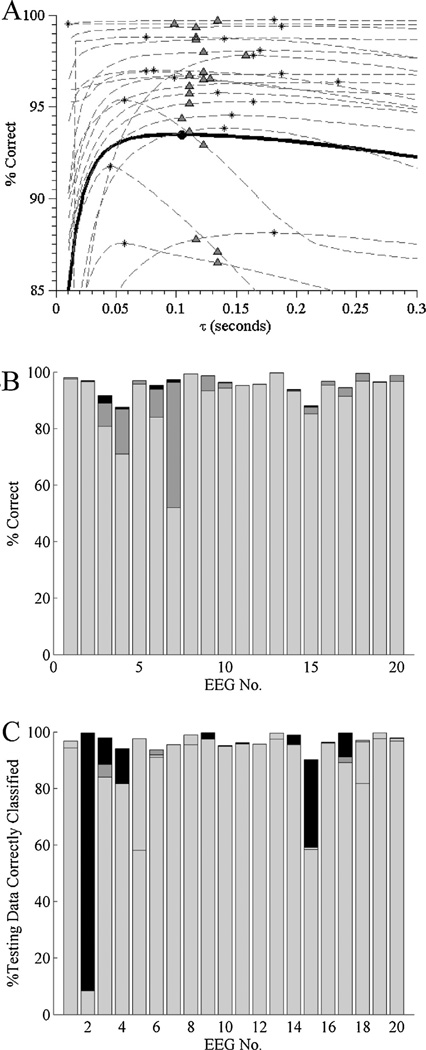
Fig. 3.
(A) Sensitivity analysis for the value of the forgetting factor, β, used in the adaptive variance thresholding segmentation algorithm. The solid curve denotes global performance, i.e. the percentage of data points correctly classified (relative to consensus regions of manually segmented data) over all 20 EEGs; the globally optimal forgetting factor value is marked with a solid filled circle. Dashed curves indicate classification performance vs forgetting factor value for each of the 20 individual patient records. Asterisks mark the patient-specific optimal value of β; open circles mark the performance on the same patient’s EEG when the globally optimal forgetting factor is used instead. For every point on every curve we use the corresponding optimal value (for that value of β) of θ, the segmentation threshold (see Eq. (3)). (B) Relative contributions to performance of patient-specific optimization of the forgetting factor, β, and the classification threshold, θ, for each of the 20 ICU burst suppression EEGs under study. Overall bar height reflects performance when both parameters are individualized. The height of the light gray bar shows performance using the globally optimized parameters; the height of the dark gray bar shows the performance gained by optimizing the threshold while using the population-level forgetting factor; and the black bar shows the (in many cases negligible) peformance gain upon patient-specific optimization of the forgetting factor.

