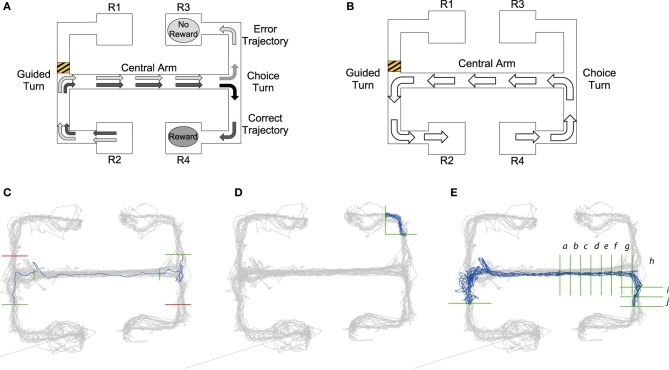
Figure 1.
(A) Visualization of choice trial starting at the R2 reward point. Black arrows demonstrate the trajectory of a “correct trial” consisting of two turns in the same direction resulting in a reward at reward point R4. Gray arrows show the trajectory of the “error trial” of two different turns resulting in no reward at reward point R3. (B) Guided trial starting at R4. The barrier placed in the upper left arm, shows that a trajectory from right to left starting at reward point R4 would result in a guided left turn. Panels (C–E): Queries from MQL toolbox used to select specific trajectories from tracking data: Query lines are shown in green, avoid lines in red, all position data is shown in gray and trajectories satisfying the MQL query are shown in blue. (C) Query to return error trials that begin at the lower left reward point. Query lines give intervals for the central arm and choice turn. In MQL query lines are numbered in a listbox and can be selected and amended using the GUI, for details on this process see the MQL website. (D) One of the 16 turn queries for the maze. This query returns trajectories from a left turn to the top right reward point. (E) A query which selects trajectories of correct trials starting at the lower left reward point, note the additional vertical query lines in the central arm that return the timestamps of intervals a–j leading up to and after the choice turn (see also Figure 4).

