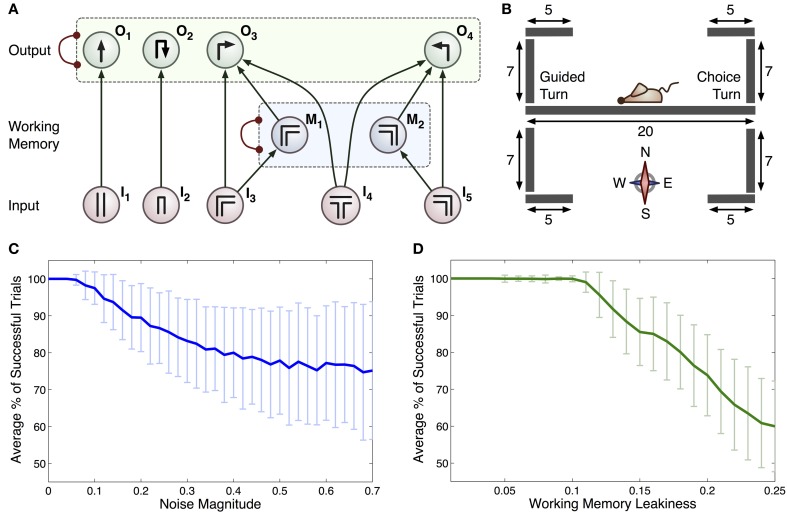
Figure 2.
(A) Connectionist model for the T-maze task. Arrows represent excitatory connections and arcs ended with circles represent inhibitory connections between all pairs of integrator within a specific group (indicated by dashed rectangles). Each input, denoted In, relates to scenarios that the rat may encounter: I1 straight corridor, I2 dead end, I3 right-hand bend, I4 T-junction, I5 left-hand bend. Actions that the rat can take are represented by: O1 move straight ahead, O2 turn around, O3 right turn and O4 left turn. The M1 and M2 integrators act as a working memory. (B) Geometry of the 2D virtual environment made up of 9 separate line segments. Initial position and orientation of the rat is shown. (C) Average % of successful trials with c (standard deviation as overall noise of all integrators) varied. (D) Average % of successful trials with standard deviation as leakiness of working memory integrators, k, is varied.

