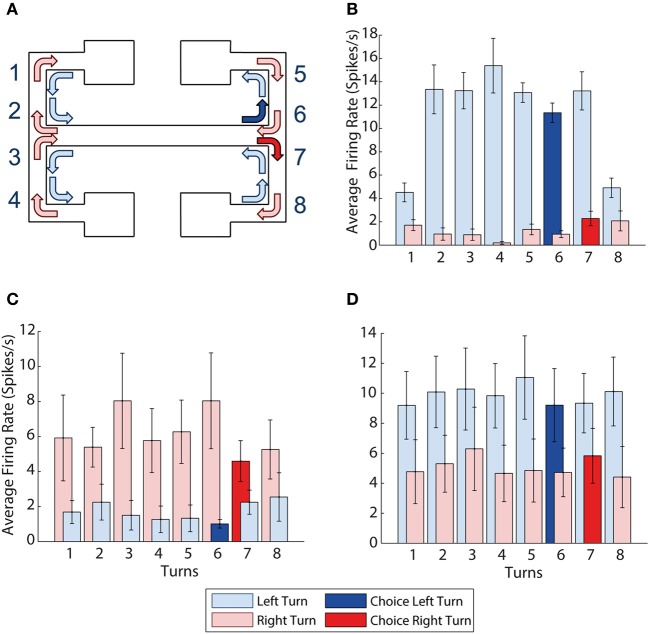
Figure 3.
mPFC activity is turn dependent. (A) Visualization of all the left and right turns in the maze, left turns shown with light blue arrows, right turns shown with light red arrows, choice right turn shown in solid red, choice left turn shown in solid blue. (B) Example of a neuron with activity selective for left turns. It shows higher average firing rates during all 8 left turns than during all 8 right turns. (C,D) Turn selectivity does not appear to be a result of one turn being over represented (C) The average activity at each of the turns for all 9 right turn preferring neurons, turn 7 is the choice turn. (D) The average activity at each of the turn for all 10 left turn preferring neurons, turn 6 is the choice turn. Error bars show the standard error of the mean.

