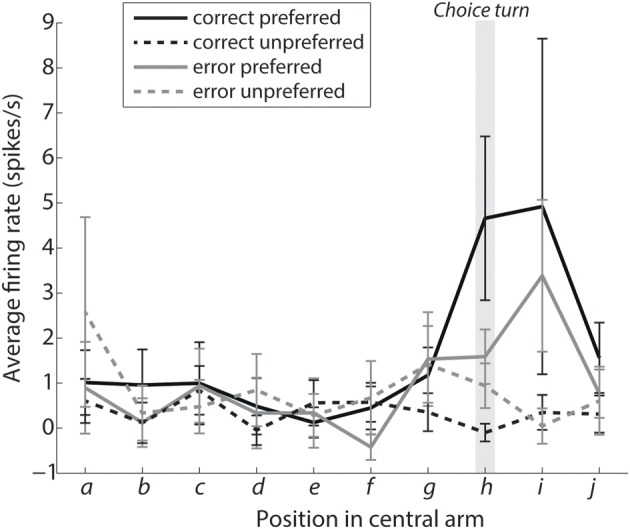
Figure 4.

Turn selective mPFC neurons display prospective ramping of activity before a choice turn in their preferred turn direction. The curves show the average firing rates during intervals leading to the choice turn labeled as shown in Figure 1E. Interval h encompasses the choice turn per se, with intervals i and j directly following the choice turn. Solid lines show the average activity of turn-selective neurons from trials when the rat turned in direction preferred by the neuron, while dashed lines are based on trials when the rat turned in the opposite direction. Please note that selectivity for the preferred direction during the choice turn is significantly reduced during error trials (shown in gray, P < 0.05).
