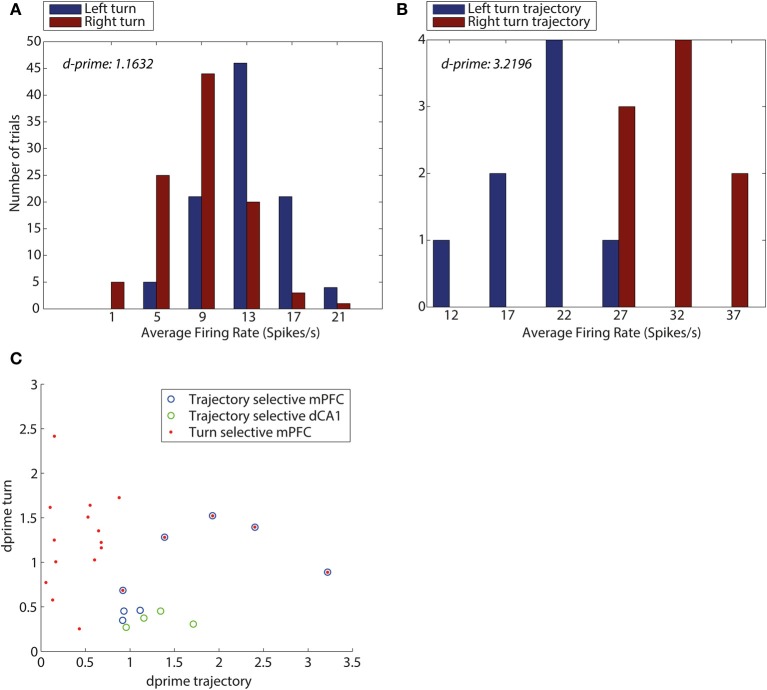
Figure 5.
D-prime values for turn direction and trajectory reveal an overlap between mPFC neurons encoding turn and trajectory. (A) D-prime score for a mPFC turn selective neuron, measuring separation of distributions of average firing rates (spikes/s), during left turns (blue) and right turns (red). (B) D-prime score for a mPFC trajectory selective neuron during trajectories making a left turn into the central arm (blue) and trajectories making a right turn into the central arm (red). D-prime values of 1.1632 and 3.2196 (left to right), plots correspond to two mPFC neurons shown in panel (C). (C) D-prime values for mPFC and dCA1 neurons measuring selectivity for turn direction and maze trajectory. Each symbol corresponds to one neuron, its y-coordinate is equal to the d-prime measuring the difference in firing rate distributions during turns left and right, the x-coordinate is equal to d-prime measure of difference in firing rates during the central arm, between trajectories from top and bottom of the maze. Neurons identified as turn selective are shown in red (mPFC), neurons identified as trajectory selective shown in blue (mPFC) and green (HPC), Neurons which were identified as both turn and trajectory selective are shown as blue with red in the center.

