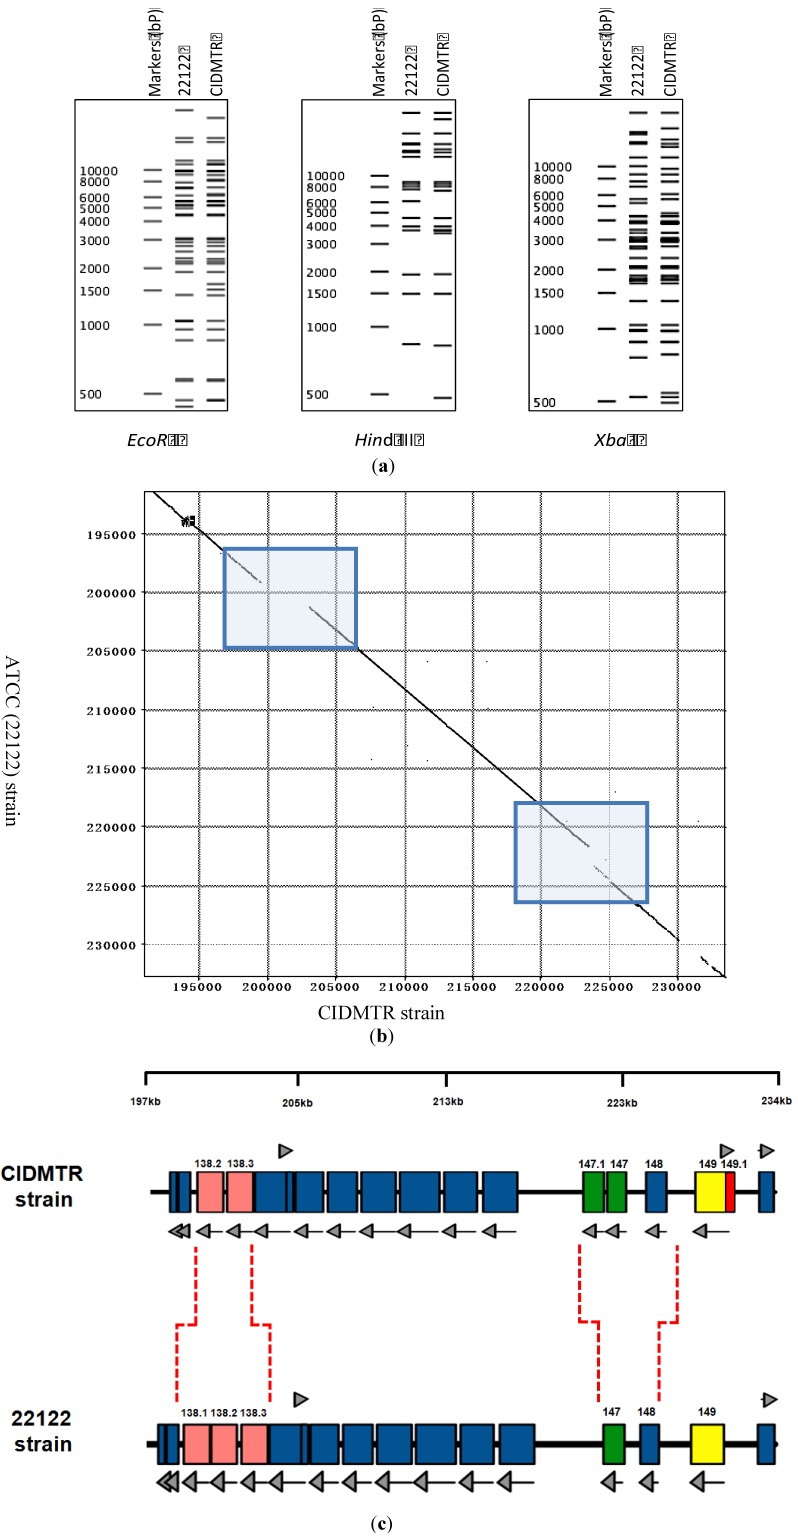
Figure 3.
Strain-specific genome structure differences between CIDMTR and 22122. (a) In silico analysis of predicted restriction endonuclease profiles for CIDMTR strain and 22122 (ATCC) strain with enzymes EcoRI, HindIII, and XbaI. Predictions and profile generated using program CLC Main Workbench 6 [40]. (b) Dot-matrix comparison of CIDMTR vs. 22122 genomic sequences. Two genome regions demonstrating sequence variability resulting in ORFs unique to each strain are indicated by shaded boxes. (c) Linear map comparison of the major areas of genome discontinuity. Linear maps prepared using XPlasMap [41]. Colored boxes in blue represent predicted conserved ORFs. Light red and green colored ORFs demonstrate discordance between the two strains. In the CIDMTR strain, an additional ORF not annotated in 22122, 149.1, is also noted (dark red). Dashed lines indicate the positions where the sequences differ. See Table 1 for a full list of sequenced gene annotations.

