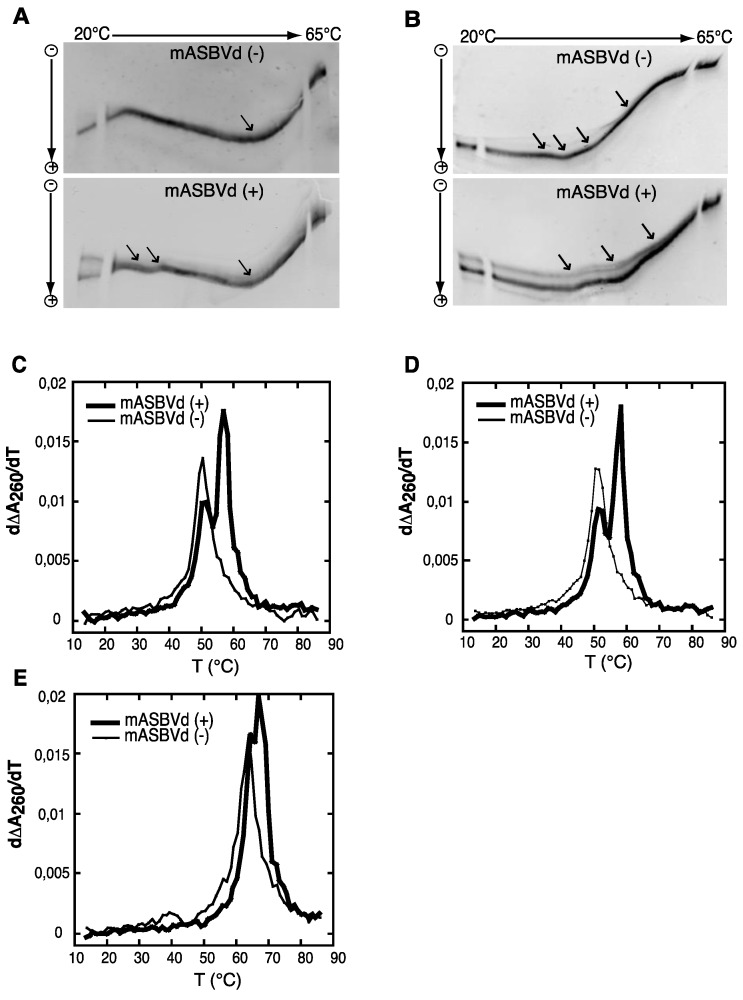
Figure 2.
Temperature gradient gel electrophoresis (TGGE) and melting curves of mASBVd (+) and mASBVd (−) transcripts. (A) TGGE analysis performed by native 8% PAGE in 0.2× TBE buffer. (B) TGGE analysis performed by native 8% PAGE in 0.2× TB buffer containing 20 μM magnesium acetate. Migration was monitored between 20 °C and 65 °C. The arrows denote the transition temperatures. Derivative absorbance melting profiles were determined either in 150 mM KCl and 10 mM sodium cacodylate (pH 7.2) (C) or with, in addition, 100 μM MgCl2 (D) or 1 M NaCl (E). The first derivative profiles (d∆A260/dT) are shown with a thick curve for mASBVd (+) and a thin curve for mASBVd (−).

