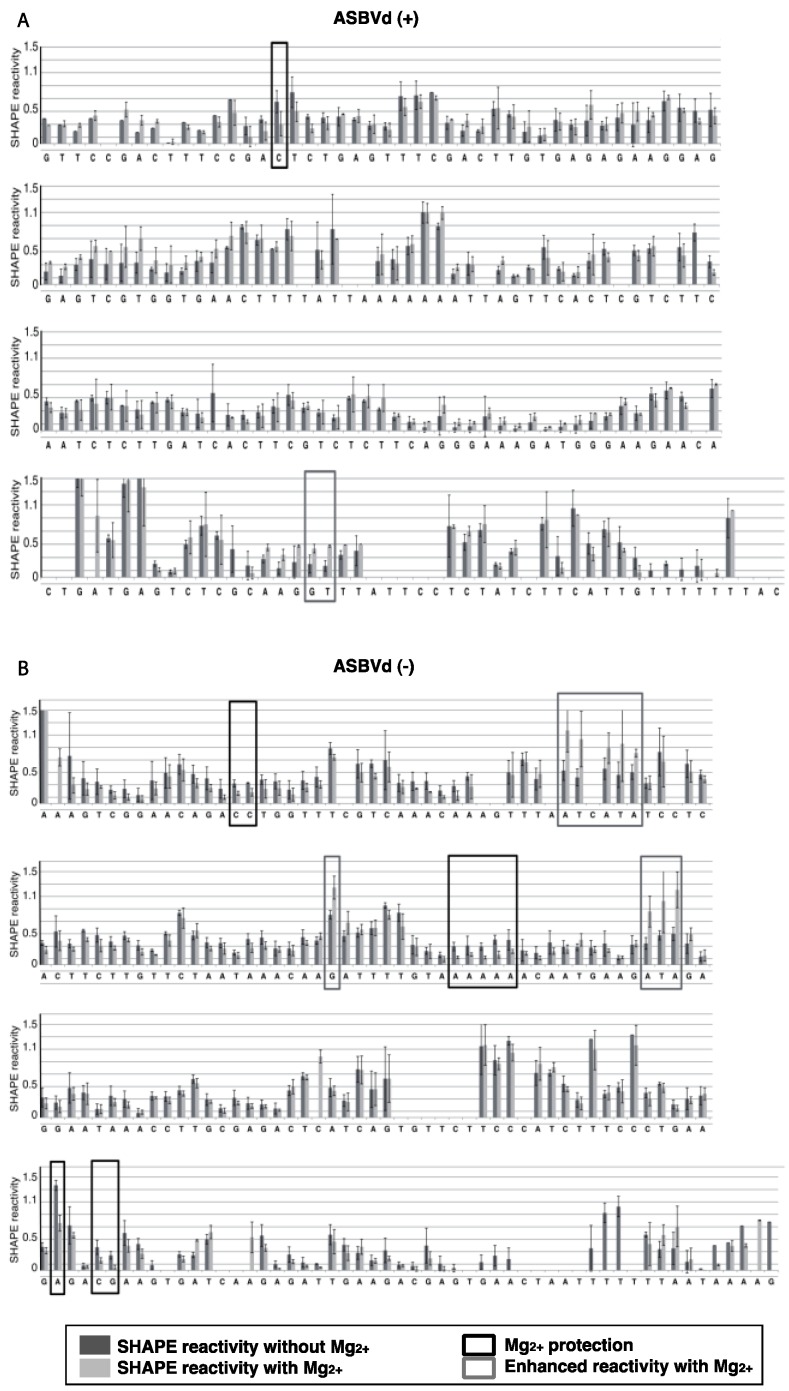
Appendix Figure A1.
Comparison of the 1M7 reactivity profiles of ASBVd (+) (A) and ASBVd (−) (B) RNAs in the absence and in the presence of Mg2+. The reactivity of each nucleotide is represented in dark grey for the experiment without Mg2+ and in light grey in presence of 10 mM Mg2+. Error bars represent the standard deviation in 3 experiments. Regions boxed in black or grey highlight the nucleotides significantly (student test p < 0.05) under-reactive or over-reactive in the presence of Mg2+, respectively. The first nucleotide of each lane is numbered, 1 denotes the transcription start. Nucleotides with a negative value correspond to non-specific reverse transcriptase stops. Please note that the nucleotides at the 3' terminus which reactivity could not be determined because they are too close to the primer are not represented in these profiles although the molecules probed correspond to the full length ASBVd (+) and ASBVd (−) (64 and 44 nucleotides respectively).

