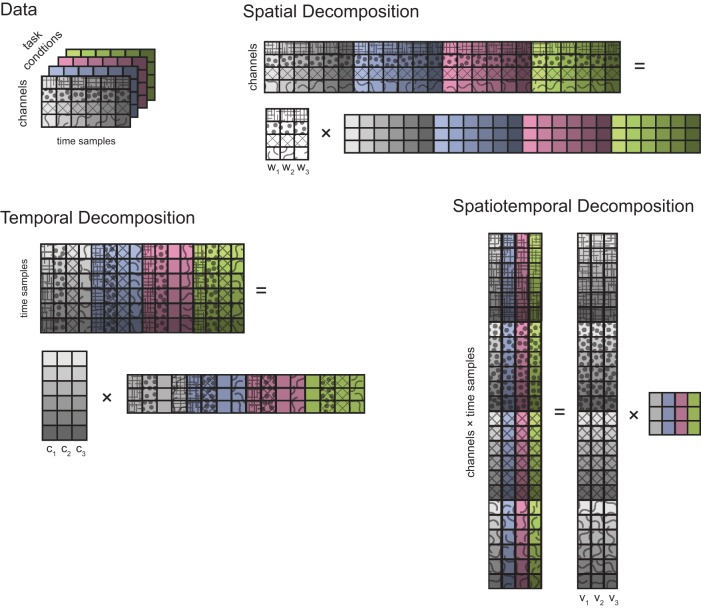
Figure 2.
Types of multidimensional decomposition of data from different task conditions. Data collected from D channels (4 in this schematic illustration, represented by different patterns) over T time samples (6, represented by different color saturations) in a single task condition are represented by a grid of squares. Different task conditions are represented with different background colors. A spatial decomposition is obtained by factorizing the data matrix obtained by stacking the data from individual conditions horizontally (i.e., matching their spatial—channels—dimension) into a matrix of N (3) spatial generators (D rows and N columns) times a matrix of time-and condition-dependent coefficients. A temporal decomposition is obtained by factorizing the transpose of data matrix obtained by stacking the data from individual conditions vertically (i.e., matching their temporal dimension) into a matrix of N (3) temporal generators (T rows and N columns) times a matrix of channel- and condition-dependent coefficients. Finally, a spatiotemporal decomposition is obtained by arranging all the data samples of each condition into a column and factorizing the resulting matrix into a matrix of N (3) spatiotemporal generators (D × T rows and N columns) times a matrix of condition-dependent coefficients.

