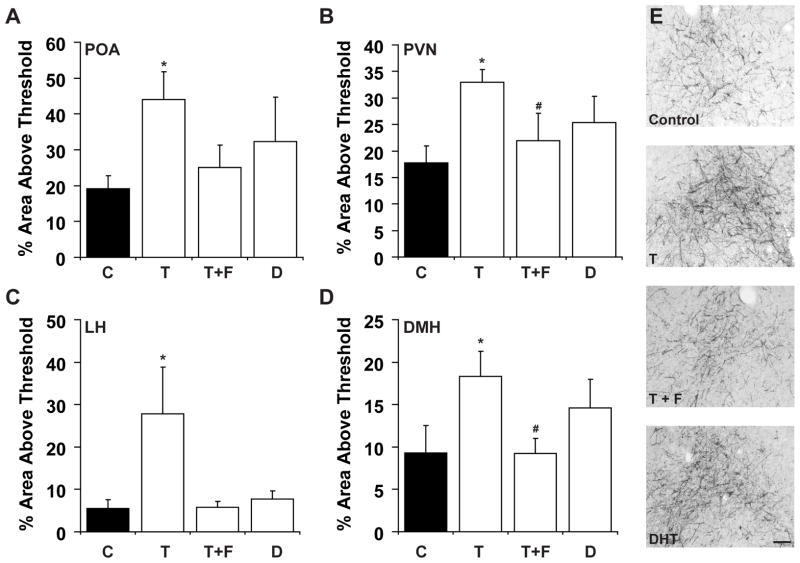
Figure 6.
Measurements of AgRP fibre density in the preoptic area (POA) (A), paraventricular nucleus (PVN) (B), lateral hypothalamus (LH) (C), and the dorsomedial hypothalamus (DMH) (D). Optical densities were measured as percentage of area above threshold level (see Methods). Treatment groups include untreated control (C), testosterone (T), testosterone and flutamide (T+F), and dihydrotestosterone (DHT) animals. (*) indicates significant difference from control (p<0.01) and T+F groups (p<0.01). E shows representative images (10X magnification) from the DMH of each treatment group. Scale bar = 100μm.

