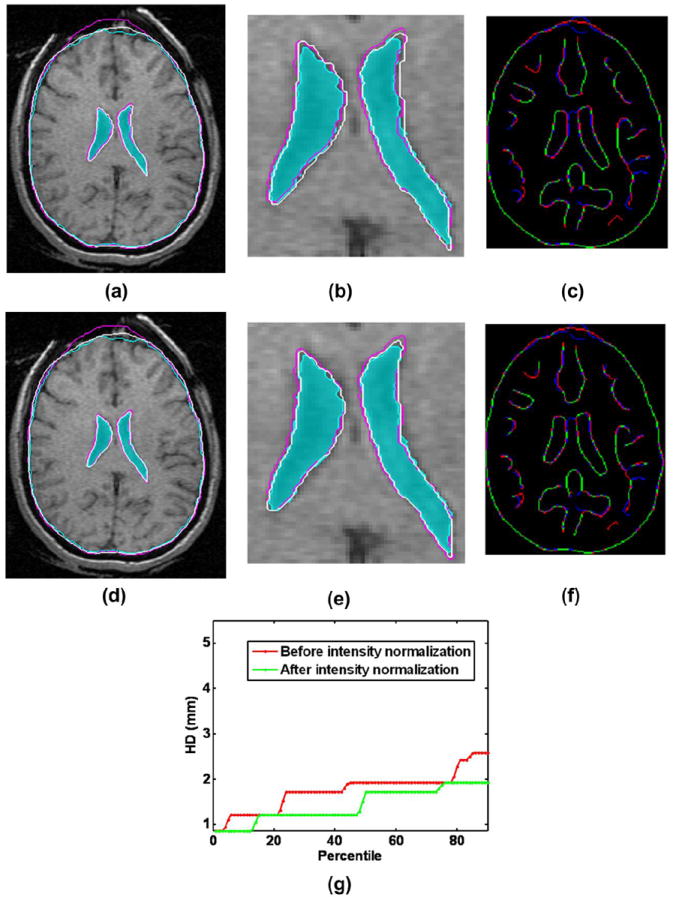
FIGURE 3.

Effect of intensity normalization on the registration result: (a) Intra-operative and warped pre-operative contours obtained without intensity normalization overlaid on the intra-operative slice; (b) A zoomed-in view of the contour ventricles in (a); (c) Corresponding Canny edges extracted from intra-operative and the warped pre-operative image slices overlaid on each other; (d) Intra-operative and warped pre-operative contours obtained with intensity normalization overlaid on the intra-operative slice; (e) A zoomed-in view of the contour ventricles in (d); (f) Corresponding Canny edges extracted from intra-operative and the warped pre-operative image slices overlaid on each other; (g) Plots of edge-based Hausdorff distances at different percentiles before and after intensity normalization. Detailed description of methods required to generate this plot is given in Section 2.3.2. All registration results were generated using skull-stripped brain volumes with 50000 spatial samples to calculate joint intensity histograms. The following color code is used for contours in (a), (b), (d) and (e): light blue shade – ventricles in the intra-operative image; light blue contour – outline of parenchyma in the intra-operative image; magenta contours – outlines of parenchyma and ventricles in the pre-operative image before registration; white contours - outlines of parenchyma and ventricles in the pre-operative image after registration. Color code for edges: Red color represents the non-overlapping pixels of the intra-operative slice, blue color represents the non-overlapping pixels of the pre-operative slice and green color represents the overlapping pixels.
