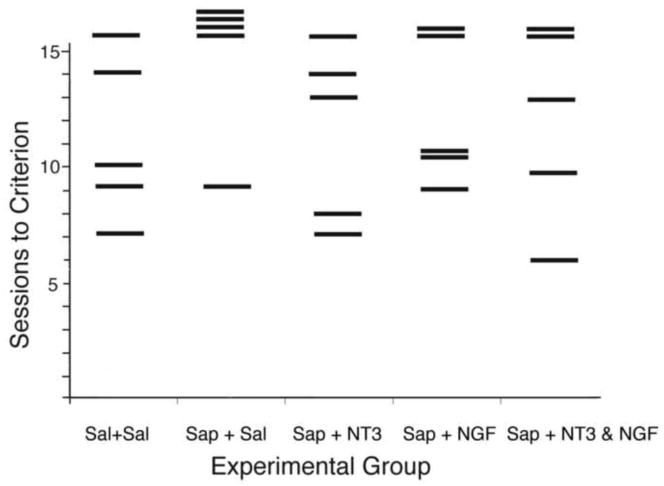
Fig. 2.
Chart shows trials to criterion (8 correct choices in 10 trials for 2 consecutive days) for individuals in each of the 5 groups on the DMP task. Criterion needed to be met in 15 or fewer trials. Individual trial to criterion is depicted by the horizontal bars. Note that only 1 of the saline group did not reach criterion, while only 1 of the saporin group did reach criterion.

