
Fig. 5.
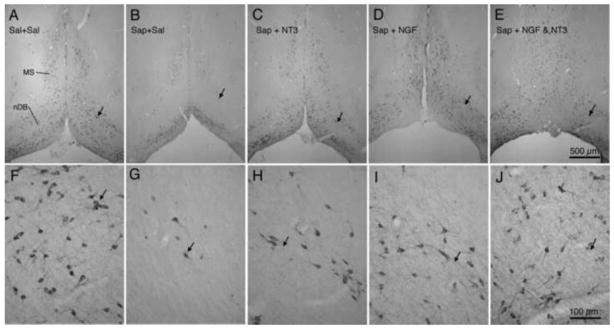
Photomicrographs show ChAT immunoreactivity in medial septum (MS) and nucleus of the diagonal band (nDB) in representative animals from each of the 5 groups. Photomicrographs in the upper row (A–E) represent lower magnification images of the basal forebrain regions, while photomicrographs in the lower row (F–J) represent higher magnification images of the same regions. The small arrows in each pair of photos indicate corresponding regions. Scale bar in E = 500 μm for A – E; bar in J = 100 μm for F – J.