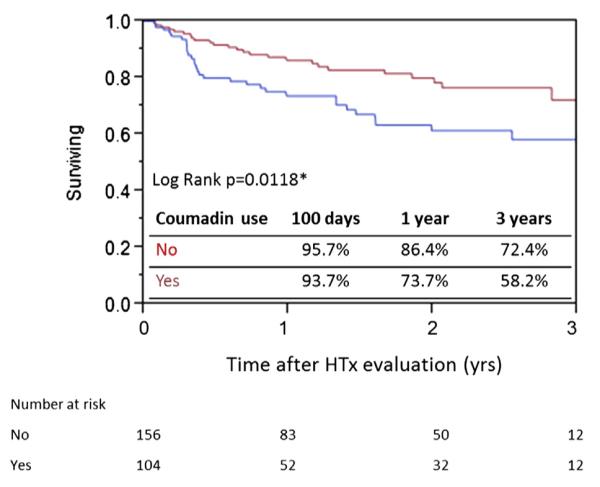
Figure 2. Kaplan-Meier Survival Curve of All Patients (N = 260) Stratified According to Anticoagulation Use.

The survivals are represented by the solid red line for patients not undergoing anticoagulation treatment (n = 156) and the solid blue line for patients receiving anticoagulation (n = 104). *Statistically significant (log rank test). HTx = heart transplantation.
