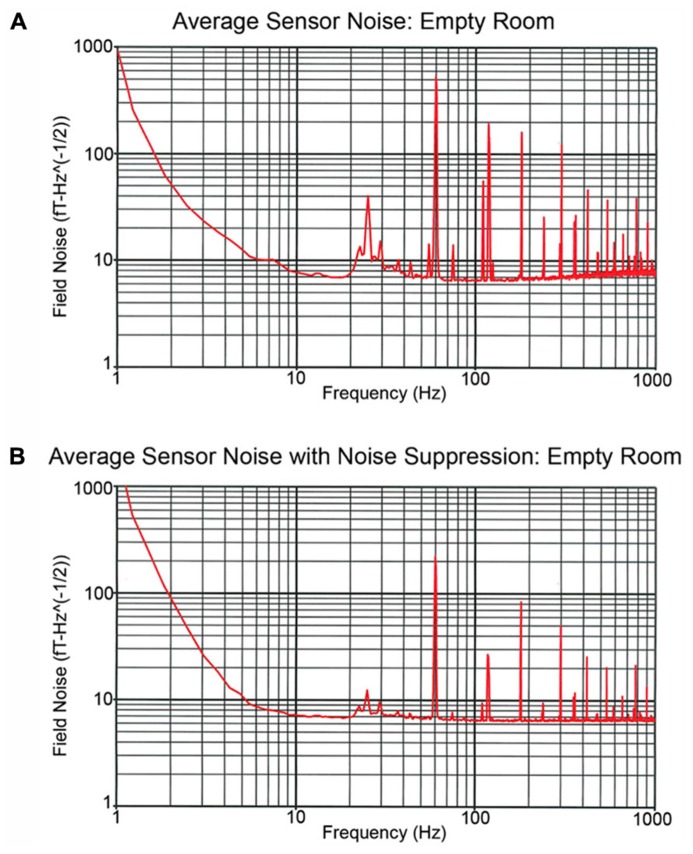
FIGURE 3.
Recordings obtained in the empty MSR. (A,B) show the spectra averaged across all sensor channels. The (A) power spectrum shows several large peaks below 100 Hz. These include the 60 Hz powerline peak as well as a peak at ~24 Hz which reflects noise from the local mass transport/train system. In (B), the reference channels were used to remove external noise, the weights obtained by calculating the covariance between signal and reference channels and then the weights applied to the raw data with no temporal filtering. (B) shows that via spatial filtering most of the noise activity below 100 Hz is removed.

