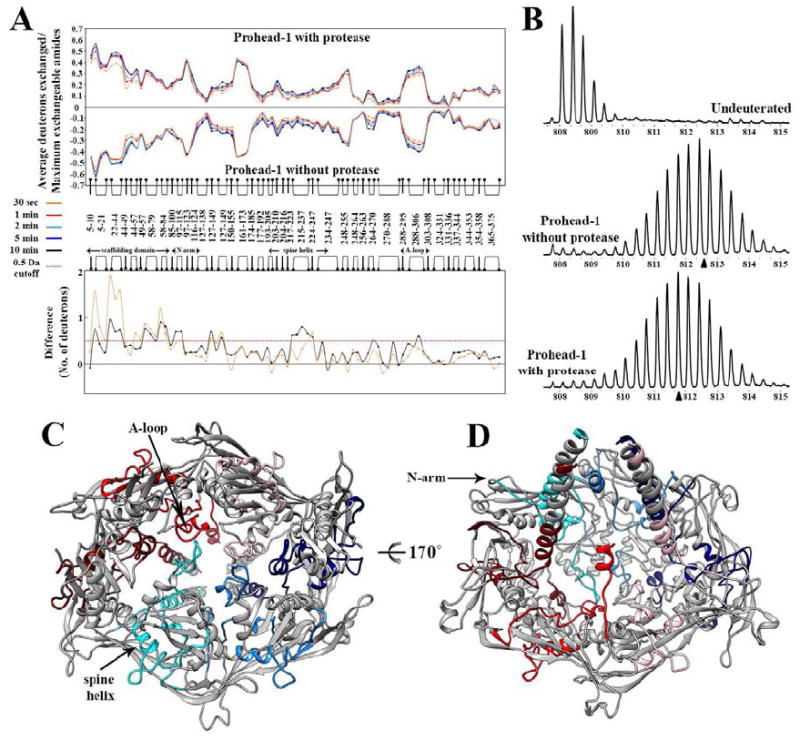
Figure 4. Interactions between the viral protease and the coat subunits studied by Hydrogen/Deuterium exchange coupled to mass-spectrometry.

(A) Top panel: Mirror plot of the relative deuterium exchange across pepsin digest fragments from N to C-terminus. Each plot represents a time point of deuterium labeling (t=30s, 1min, 2min, 5min, 10min), color coded as indicated. Bottom panel: Difference plot showing the average mass difference resulting from deuterium exchange between the two Prohead-1 forms, i.e. protease-free minus protease-containing procapsids. Positive differences represent regions that are protected from deuterium exchange in presence of the protease. (B) Illustration of the mass spectra obtained for the peptide 22-43. (Top) Undeuterated Prohead-1 without protease, (Middle) Prohead-1 without protease after 2 min of exchange, (Bottom) Prohead-1 with protease after 2 min of exchange. The triangles indicate the centroid of each spectrum obtained after 2 min of exchange. (C) View of the coat subunit hexon from the procapsid exterior. The regions featuring the highest solvent protection in presence of the protease are colored according to the scheme defined in Figure 1 whereas the other parts of the coat subunits are colored gray. (D) View from the procapsid interior of the coat subunit hexon colored as in (C). In panels A and B, peptides are depicted as linked bullet points and correspond to the composite residues in each location analyzed generated by overlapping pepsin digest fragments.
