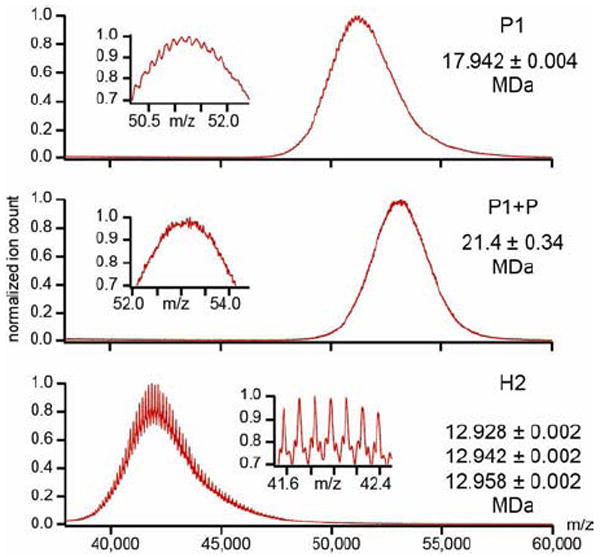
Figure 5. Native mass-spectrometry quantification of protease packaging and cleavage efficiency.

(top) The mass spectrum obtained for the protease-free procapsid indicates a mass of 17.9 +/- 0.004 MDa while the theoretical one is 17.7MDa (mass accuracy of 1%). (middle) The mass spectrum obtained for the protease-containing procapsid is noisier and yields a mass estimate of 21.4 ± 0.34 MDa. (bottom) Mass spectrum of Head-2 reveals three distributions with a mass of approximately 12.9 MDa. The masses are consistent with a highly efficient maturation cleavage but clearly reveal some residual material in the Head-2 particles. (insets) Zoom-in of the indicated m/z region to reveal the fine structures on the signal.
