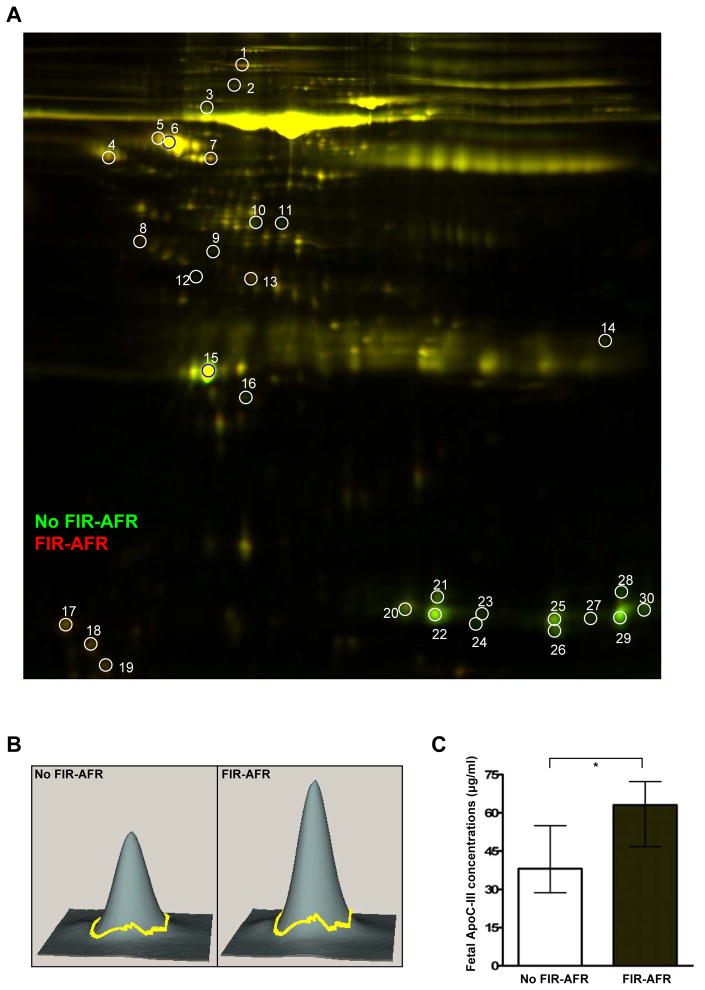
Figure 4. Comparison of the fetal blood proteome between cases with and without fetal inflammatory response associated with maternal anti-fetal rejection.
(A) Two-dimensional difference gel electrophoresis (2D-DIGE) images show differentially abundant proteins between cases with (Cy5: red) and without (Cy3: green) Fetal inflammatory response associated with maternal anti-fetal rejection. The spots are labeled by number. (B) Three-dimensional images from DeCyder software analysis for spot 17 marked in the 2D-DIGE image (A), which is increased in cases with fetal inflammatory response associated with maternal anti-fetal rejection. The spot was identified as apolipoprotein C-III by MALDI-TOF-MS/MS. (C) The difference in apolipoprotein C-III concentration in fetal serum samples between the cases with and without fetal inflammatory response associated with maternal anti-fetal rejection was confirmed by specific immunoassay (P=0.013).
*P<0.05 (by the Mann-Whitney U test)
ApoC-III, Apolipoprotein C-III; FIR-AFR, fetal inflammatory response syndrome associated with maternal anti-fetal rejection.

