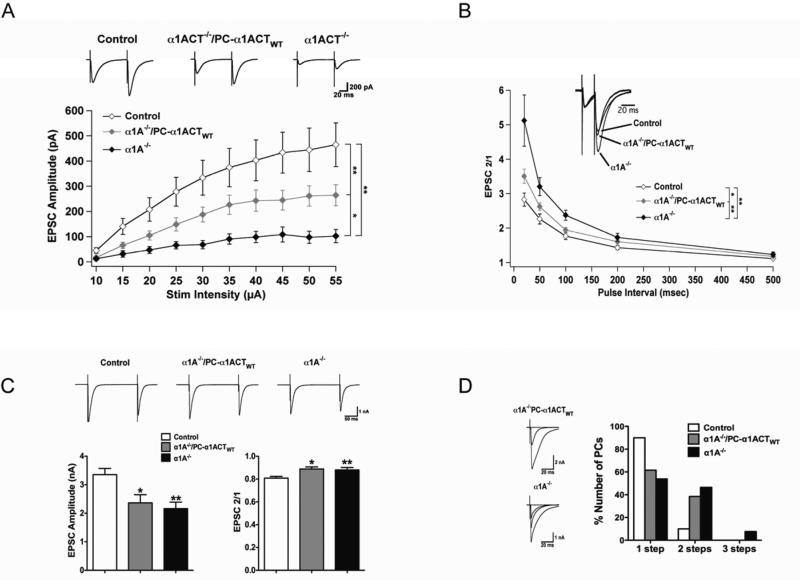
Figure 6. α1ACT partially restores PF EPSC amplitude but does not affect CF innervation or EPSC properties.
(A) PF-EPSC amplitude as a function of stimulus intensity for α1A−/− (n = 9, N = 4), α1A−/−/PC-α1ACT (n = 16, N = 6), and WT (n = 11, N = 3) mice. Top: Typical PF-EPSCs at a stimulus intensity of 45 μA. (B) Paired-pulse ratios as a function of stimulus interval in α1A−/−, α1A−/−/PC-α1ACT, and WT mice. Inset shows an overlay of representative traces from all three groups of mice with an interstimulus interval of 20 ms. EPSC1 from α1A−/−/PC-α1ACT and WT mice were scaled to match the amplitude of EPSC1 from the α1A−/− mouse to facilitate comparison. (C) Top: Representative CF-EPSCs elicited while holding at -30 mV. Bottom left: CF-EPSC amplitudes for α1A−/− (n = 10, N = 3), α1A−/−/PC-α1ACT (n = 11, N = 3), and WT (n = 8, N = 3) mice. Bottom right: Paired-pulse depression of CF-EPSCs with 200 ms stimulus interval. (D) Left: representative traces from PCs in α1A−/− and α1A−/−/PC-α1ACT mice exhibiting multiple CF innervation. Right: Percentage of PCs exhibiting either one, two, or three discrete CF steps in α1A−/− (2 steps: 6/13, 3 steps: 1/13, N = 3), α1A−/−/PC-α1ACT (2 steps: 5/13, N = 3), and WT (2 Steps: 1/9, N = 3) mice. All mice were age P16-18. *p<0.05, **p<0.01. Data are mean ± SEM.

