
Figure 1. A single round infectivity assay[24].
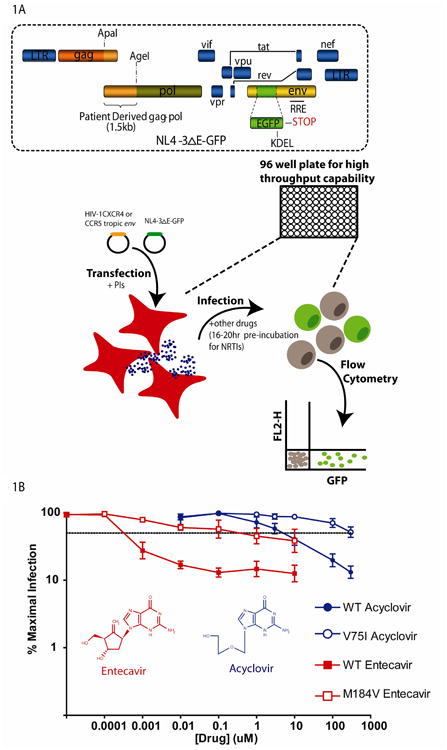
(A) HEK 293T cells are transfected with two constructs. One construct, NL4-3ΔE-GFP contains the HIV-1 genome with part of the envelope gene deleted and replaced with GFP. The second construct contains either an HIV-1 CXCR4 or CCR5 tropic envelope gene. Virus is collected from culture supernatants and used to infect primary activated CD4+ T cells isolated from healthy blood donors. GFP expressing cells are quantified by flow cytometry 3 days post infection. Drugs are added to cells at the time of transfection or 16-20 hours prior to infection. (B) Dose response curves for the anti-Hepatitis B drug entecavir and the anti-Herpes drug acyclovir against wild type (WT (closed symbols) and mutant (open symbols) HIV-1 using the phenotypic assay. Dose response curves represent the percentage of cells infected in the presence of drug divided by the percentage of infected cells with no drug effect. The dashed line represents 50% inhibition. The mutants M184V and V75I were selected for by entecavir monotherapy (in vivo) or acyclovir (in vitro), respectively, and have shifted dose response curves and increased IC50 values compared to wild-type virus.