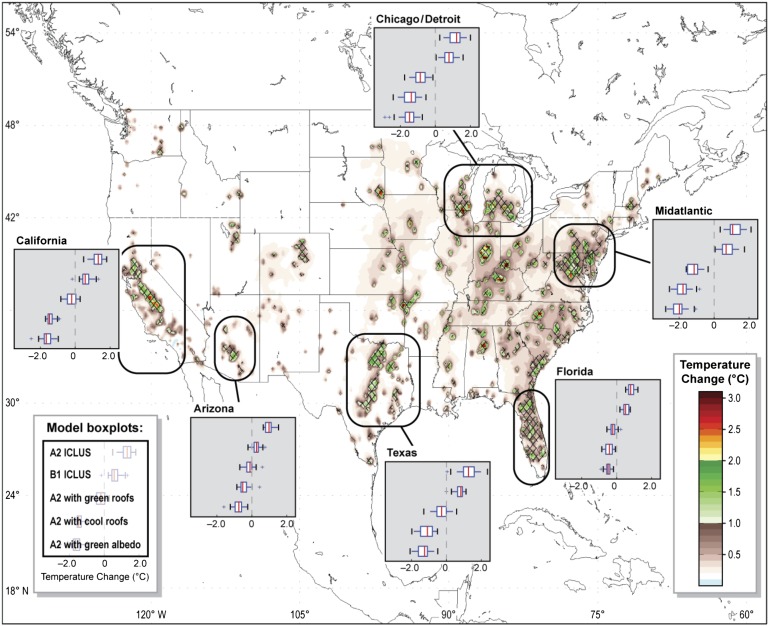
Fig. 1.
Simulated June–July–August (JJA) 2-m air temperature difference between A2 and control (°C). Black hatching indicates differences that are virtually certain (greater than 99% probability) to be significant according to the pairwise comparison test (SI Appendix). Estimated impacts of all expansion and adaptation scenarios for indicated urban areas are shown as Insets, with black ovals outlining each region. Red lines show median impacts; blue box bars show first and third quartiles, and whiskers represent 1.5 times the interquartile range from 24 simulated summers. For each region, box plots indicate differences between A2 and control, B1 and control, A2 green roofs and control, A2 cool roofs and control, and A2 with green–albedo roofs and control from top to bottom, respectively.

