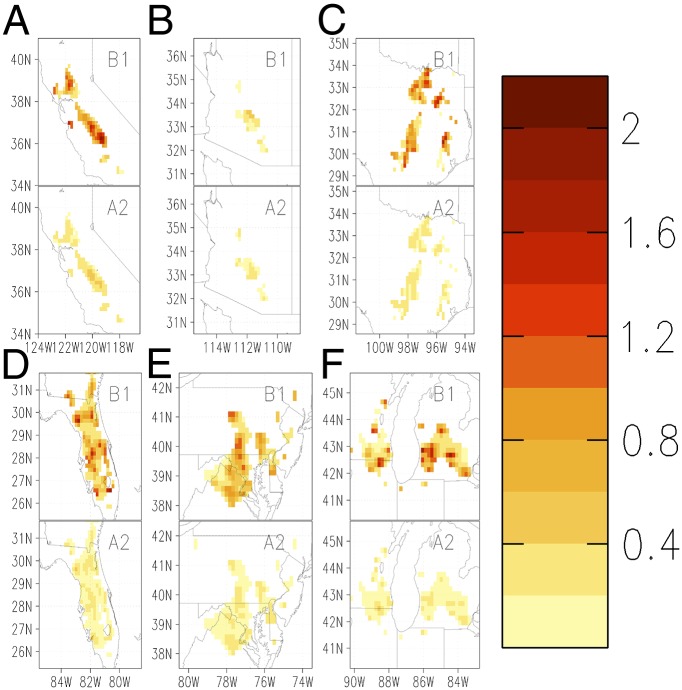
Fig. 3.
Simulated JJA urban relative to greenhouse gas-induced impacts on 2-m air temperature (units are °C °C−1). Calculations performed for the B1 urban expansion scenario relative to the RCP2.6 pathway are denoted as B1, and calculations performed for the A2 urban expansion scenario relative to the RCP8.5 pathway are denoted as A2. The following regions are shown: (A) California, (B) Arizona, (C) Texas, (D) Florida, (E) Mid-Atlantic, and (F) Chicago/Detroit urban areas. Impacts are shown only for statistically significant grid cells as described and illustrated in Fig. 1.

