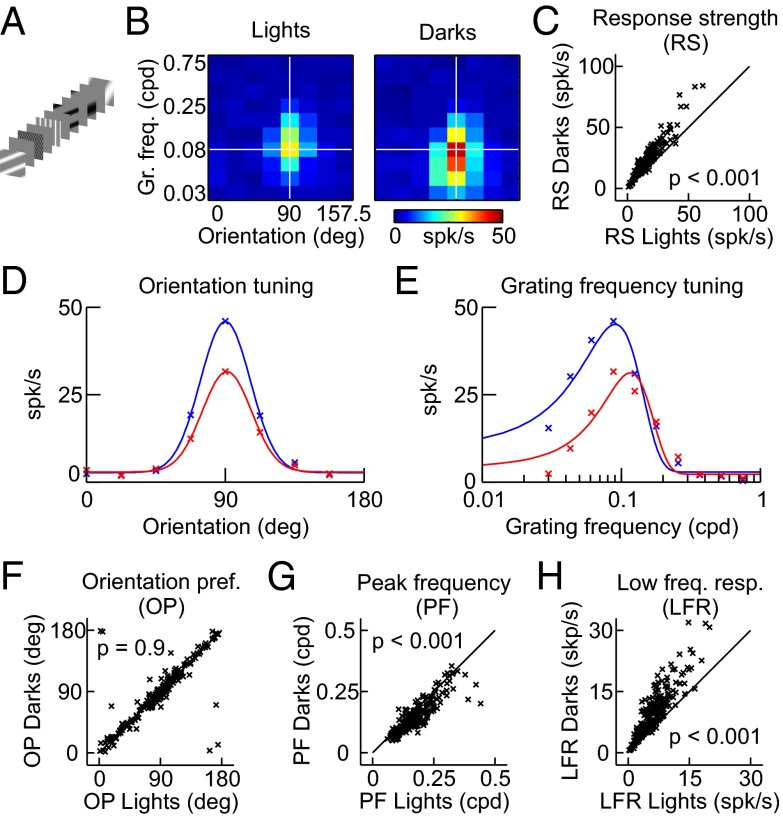
Fig. 2.
Orientation and grating frequency tuning of lights and darks in V1. (A) Stimulus design. Light and dark half-wave rectified sinusoidal gratings were flashed for 100 ms on a gray background. Grating frequency and orientation were varied in random order. (B) Example response maps to light and dark gratings measured in a V1 recording site. Dark gratings caused stronger responses than light gratings, especially when the grating frequency was low. (C) The V1 response strength (RS) was consistently higher for dark than light gratings. (D) Orientation tuning estimated at the peak grating frequency (horizontal white lines in B). (E) Grating frequency tuning estimated at the preferred orientation (vertical white lines in B). (F) V1 orientation preference (OP) was similar when measured with dark and light gratings. (G) V1 peak grating frequency (PF) was higher when measured with light than dark gratings. (H) The V1 low frequency response (LFR) was much stronger for dark than light gratings. LFR, value of Gaussian fit at a grating frequency of 0 cpd.

