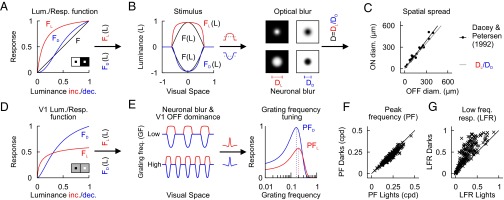
Fig. 6.

ON and OFF luminance/response functions explain difference in spatial resolution between darks and lights. (A) Luminance/response functions for lights (FL) and darks (FD) on dark/light backgrounds (stimulus shown in Inset). FD is closer to a linear function (F) than FL. (B) A stimulus projected on the retina F(L) is blurred by both the optics of the eyes (optical blur) and the luminance/response functions (neuronal blur). The light stimulus FL(L) becomes broader than the dark stimulus FD(L) and, therefore, the spatial distortion is larger for lights than darks (DL > DD). (C) The ratio DL/DD matches the ratio between the dendritic field diameters of ON (ONdiam) and OFF (OFFdiam) retinal ganglion cells (11). That is, ONdiam ∼ OFFdiam × DL/DD. (D) V1 luminance/response functions for lights and darks on gray backgrounds (stimulus shown in Inset). (E) The neuronal blur and the cortical OFF dominance cause light half-wave rectified gratings to be wider but smaller in amplitude than dark half-wave rectified gratings (Left). When convolved with the synaptic dendritic field (insets next to arrow), the grating distortions lead to differences in spatial frequency tuning. (F) The spatial distortion of the neuronal blur makes the peak frequency higher for rectified light gratings (PFL) than dark gratings (PFD). Compare with Fig. 2G. (G) The cortical OFF dominance makes the LFR stronger for dark than light gratings. Compare with Fig. 2H. For more detail, see SI Text.
