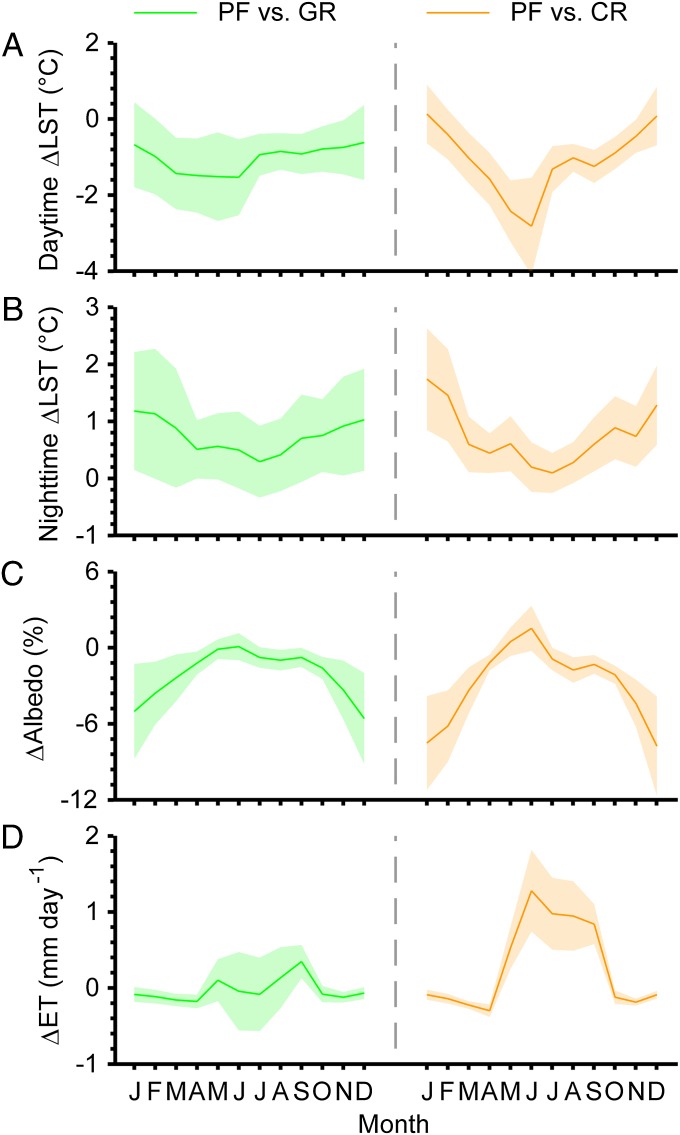
Fig. 4.
Mean seasonal cycle of differences in (A) daytime and (B) nighttime LST, (C) ΔAlbedo (%), and (D) ΔET (mm day−1) between PF and the adjacent GR and CR in northern China (north of 35°N) during the period 2003–2010. The colorful lines and lighted shaded areas represent the mean and SD of all sample grid cells north of 35°N, respectively.

