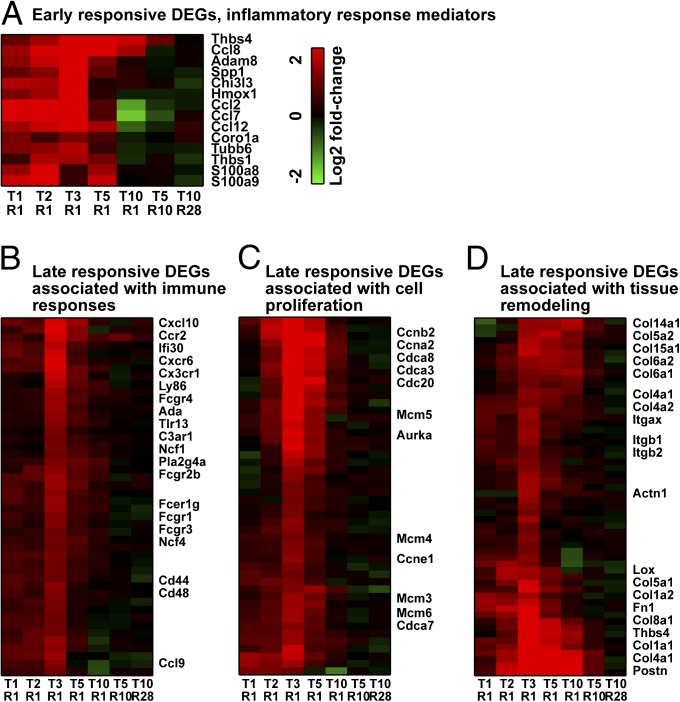
Fig. 1.
Heat maps of DEGs representing different biological processes. DEGs represent early [(A) inflammatory response mediators] and late responses [(B) immune response, (C) cell cycle, and (D) tissue remodeling across different lengths of stress exposure]. Red and green indicate higher and lower expression levels, respectively. The gene identities are listed on the right, and the experimental conditions are indicated at the bottom. Ccn, cyclin; Cdc, cell division cycle; Col, collagen.

