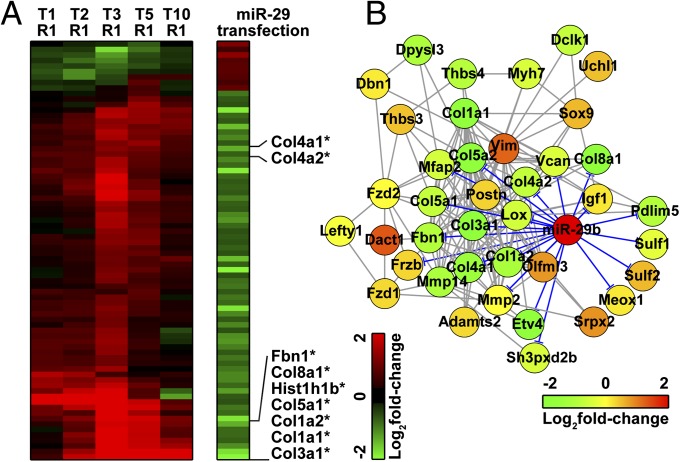
Fig. 3.
(A) Heat map of genes that might be associated with miR-29 expression level. Among the 713 DEGs identified in heart tissues, 76 DEGs showed association with miR-29 transfection. Genes involved in module 12 are indicated by asterisks. The effect of miR-29 transfection on the gene module 12 is shown in B. Expression-level changes of individual genes across different experimental conditions are expressed in concentric circles, where the innermost circles represent the fold changes between stressed and control samples in the shortest exposure group (T1R1) and the outermost circles represent the longest exposure group (T10R1).

