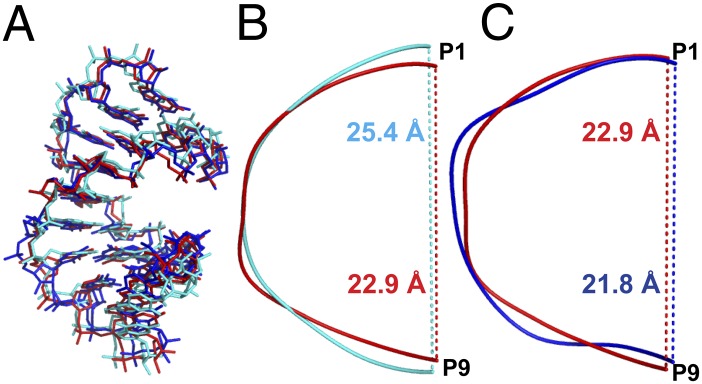
Fig. 3.

Structural comparison of native duplex (cyan), a duplex containing a single 2′-5′ linkage per strand (red), and a duplex containing three 2′-5′ linkages per strand (blue). (A) Overall duplex comparison of all of the three structures. (B) Backbone distance between P1 and P9 in native duplex (25.4 Å in cyan) and duplex containing single 2′-5′ linkage per strand (22.9 Å in red). (C) Backbone distance between P1 and P9 in duplex containing single 2′-5′ linkage per strand (22.9 Å in red) and duplex containing three 2′-5′ linkages per strand (21.8 Å in blue).
