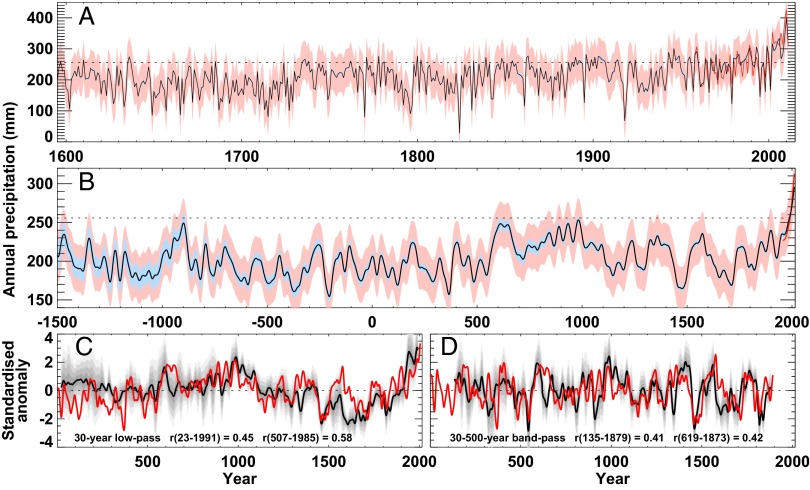
Fig. 3.
Reconstructed annual precipitation for the northeastern Tibetan Plateau and comparison with a composite NH temperature reconstruction. (A) Estimates of annual precipitation from the calibrated QLS chronology, showing yearly values since 1595, together with the total uncertainty (pale red) and the part of the uncertainty arising from chronology uncertainty (pale blue), and the observed regional precipitation since 1957 (red). The horizontal dotted line indicates the mean precipitation over the calibration period (1957–2011). Note that the calibration residuals show that the estimated values somewhat exaggerate the dryness in some dry years (e.g., 1978 and 1998), and this should be borne in mind when interpreting extremely dry years in the reconstruction. (B) As A, except the data are shown for the period since –1500 with 50-y smoothing (smoothed values will be more uncertain near the end of the time series). (C) Comparison of the precipitation reconstruction (red) with a composite of NH temperature reconstructions (black line, composite mean; four levels of gray shading, composite mean ± 0.5, 1.0, 1.5, and 2.0 composite SDs). All series have been normalized to have zero mean and unit SD over the common overlap period (Methods) and smoothed with a 30-y low-pass Gaussian-weighted filter, truncated seven values from each end to reduce the influence of filter end effects. Correlations between the precipitation and composite-mean temperature reconstructions are indicated on the panel for the full overlap period and the shorter period when at least six NH temperature reconstructions are available. (D) As C, except that all series have been band-pass–filtered to retain variance on timescales between 30 and 500 y, and the truncation is extended to 119 values from each end because the end effects of a 500-y filter are much greater (SI Appendix, Fig. SG1).

