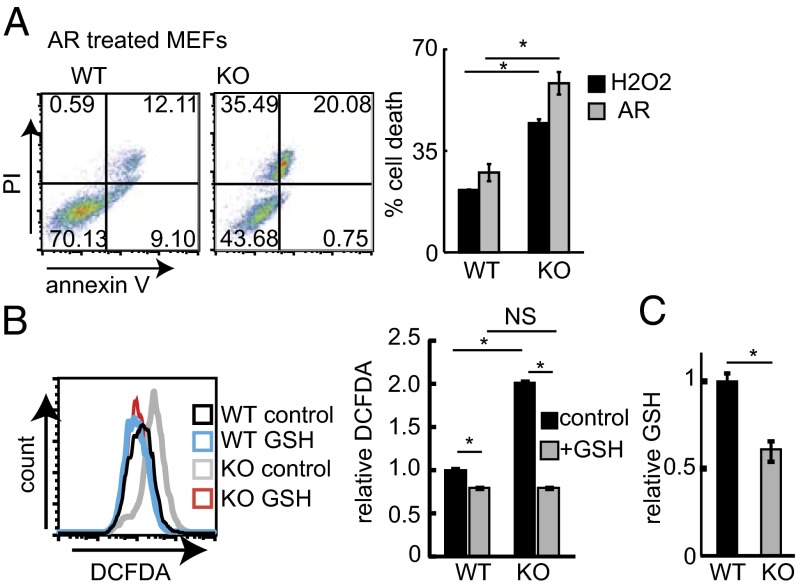
Fig. 1.
HACE1 loss reduces antioxidative stress responses. (A) Hace1 WT or KO MEFs were treated with H2O2 (400 μM) or AR (10 μM) for 8 h, and cell death was determined by annexin V and propidium iodide (PI) staining. (Left) Typical FACS plots. (Right) Cell death relative to control. n = 3; *P < 0.05. (B) ROS levels in Hace1 WT and KO MEFs treated with GSH (1 μM; 16 h) or untreated controls were determined using 2′,7′–dichlorofluorescein diacetate (DCFDA) and FACS. (Left) Typical histograms. (Right) Relative fluorescence levels. n = 3; *P < 0.05; NS, nonsignificant. (C) GSH levels were measured in lysates obtained from Hace1 WT or KO MEFs. Values are relative to Hace1 WT. n = 3; *P < 0.05.

