Fig. 4.
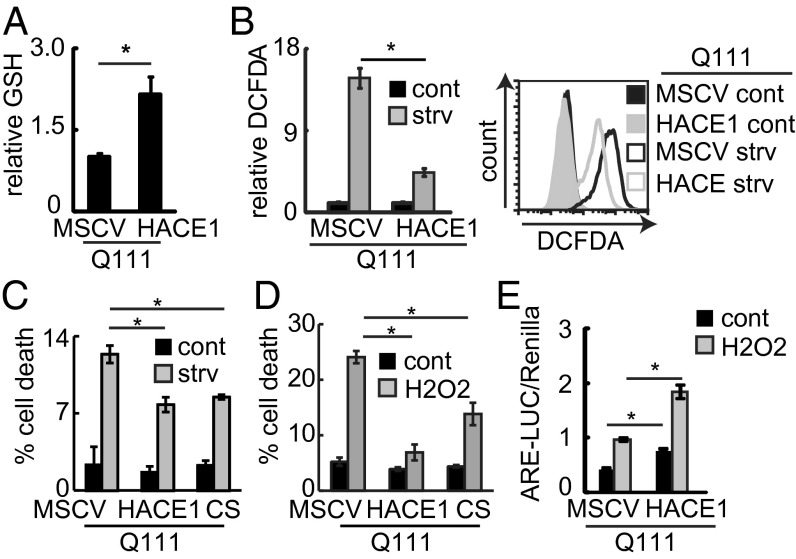
HACE1 mitigates mHTT-associated oxidative stress and toxicity. (A) GSH levels in the indicated STHdh cells lysates were measured and presented relative to MSCV. n = 3; *P < 0.05. (B) STHdh cells were grown in complete media or serum starved for 6 h. ROS were measured using DCFDA. (Left) Average geometric means relative to MSCV. n = 3; *P < 0.05. (Right) Typical FACS histograms. (C) The indicated STHdh cells were serum starved for 24 h. Cell death was measured using PI staining. n = 3; *P < 0.05. (D) The indicated STHdh cells were treated with H2O2 (400 μM; 24 h) and cell death was measured using PI staining. n = 3; *P < 0.05. (E) NRF2 activity in STHdh cells transfected with the indicated constructs and treated with H2O2 (200 μM) for 8 h was measured using ARE–LUC assay. n = 3; *P < 0.05.

