Fig. 1.
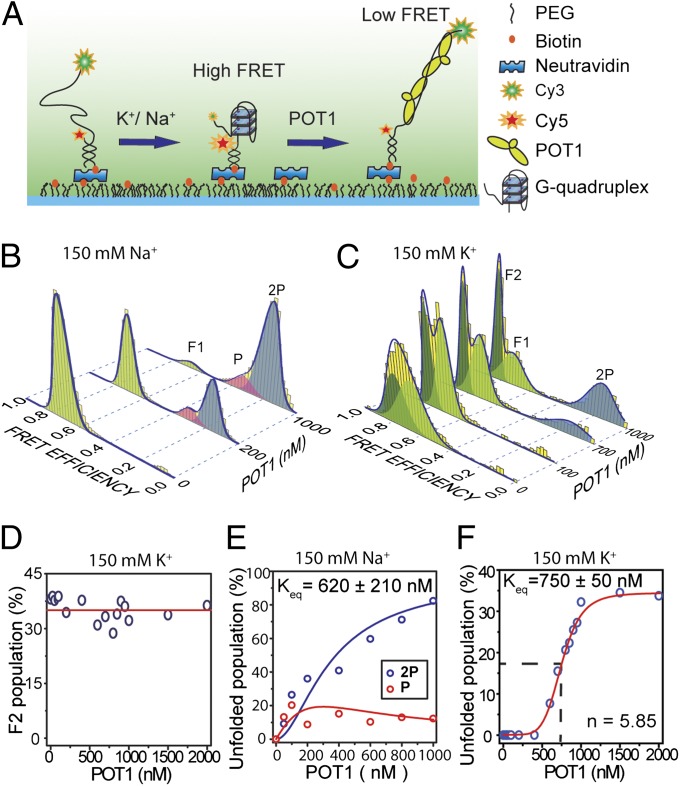
Steady-state equilibrium of POT1-mediated GQ unfolding in the presence of either 150 mM K+ or 150 mM Na+. (A) Schematic of smFRET assay under TIRF illumination to monitor the folding/unfolding of a model telomeric GQ. (B) smFRET data (yellow bars) showing unfolding of GQ at varying concentrations of POT1 in 150 mM Na+. A multi-Gaussian fitting (blue curve) determines three distinct FRET peaks (F1, P, and 2P). F1 (EF = 0.70, light green) represents antiparallel GQ. P (EF = 0.32 pink) and 2P (EF = 0.16, blue) correspond to one and two POT1-bound unfolded ssTEL4, respectively. (C) smFRET data showing unfolding of GQ at varying concentrations of POT1 in 150 mM K+. Unlike Na+, two folded populations, F1 (EF = 0.70, light green) and F2 (EF = 0.80, dark green), and one unfolded population (2P, EF = 0.16, blue) were observed. F2 is consistent with the parallel GQ conformation. (D) In 150 mM K+, POT1 is unable to unfold the F2 population, which remains nearly constant (red line) from 0 to 2,000 nM POT1. (E) The percentage of P and 2P at 150 mM Na+ as a function of POT1 concentration. Global fitting of the data to fractional occupancy of two distinguishable sites as a function of substrate concentration yields Keq = 620 ± 210 nM and cooperativity of −1.5 kBT. Increasing the parameters of the fit for the cooperative model significantly improves the fit (F test, F = 11.2, α = 0.05), and hence is justifiable. (F) At 150 mM K+, the percentage of the 2P population (blue circles) increases as a function of POT1 concentration, owing to the unfolding of the F1 conformation. The 2P population is fitted to a Hill equation (red line).

