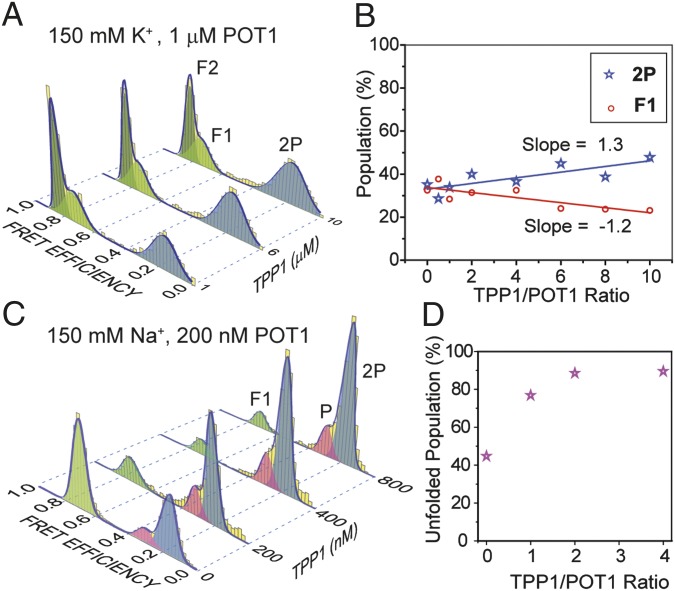
Fig. 2.
The effect of TPP1 on POT1-mediated GQ unfolding in the presence of either 150 mM K+ or 150 Na+. (A) Unfolding of telomeric GQ as a function of TPP1 concentration in 150 mM K+ and 1 µM POT1. (B) In 150 mM K+, the 2P population increases 1.3% per μM of TPP1 (blue line) and the F1 population decreases at a similar rate (1.2% per μM of TPP1, red line). (C) Unfolding of telomeric GQ as a function of TPP1 concentration in the presence of 150 mM Na+ and 200 nM POT1. (D) In 150 mM Na+, the percentage of unfolded populations (P + 2P) increases by a factor of 2 when TPP1:POT1 ratio is increased from 1:1 to 2:1 at 200 nM POT1.

