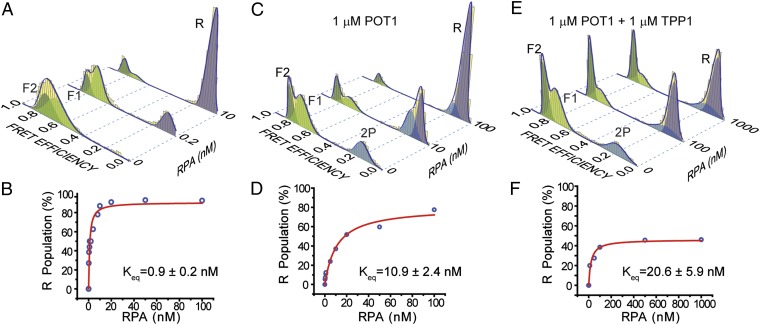
Fig. 3.
Competition between RPA versus POT1 or POT1/TPP1 to bind ssTEL4 in 150 mM K+. (A) FRET histograms display unfolding of GQ and binding of RPA to the unfolded ssTEL4 (R peak at EF = 0.10, lavender); ∼90% of GQ molecules are unfolded at 10 nM RPA. (B) Langmuir binding isotherm analysis (red curve) of RPA-mediated unfolding for the RPA-only case. (C) Unfolding of GQ and binding of RPA to the unfolded ssDNA in the presence of 1 µM POT1; ∼90% of GQ molecules are unfolded at 100 nM RPA concentration. (D) Langmuir binding isotherm analysis (red curve) of RPA-mediated unfolding in the presence of 1 µM POT1. (E) Unfolding of GQ by RPA in the presence of 1 µM POT1/TPP1; ∼47% of GQ molecules are unfolded at 1 µM RPA. Peak position of R (0.10) is distinct from 2P (0.16). Peak positions of F1 and F2 are similar to the POT1-only case. (F) Langmuir binding isotherm analysis (red curve) of RPA-mediated unfolding in the presence of 1 µM POT1/TPP1.

