Fig. 4.
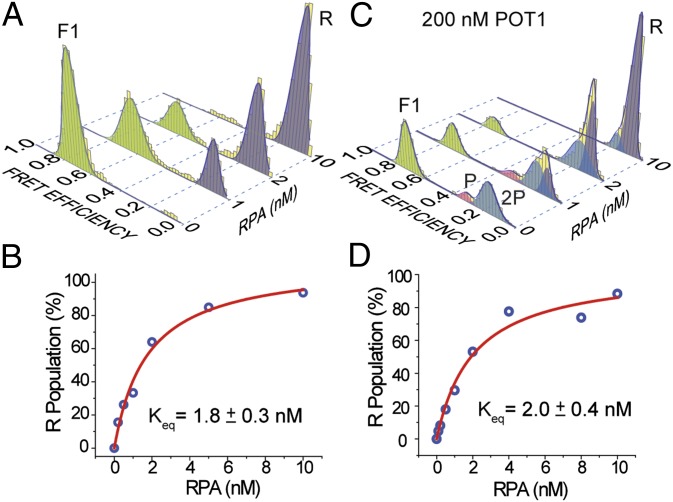
Competition between RPA versus POT1 to bind ssTEL in 150 mM Na+. (A) FRET histograms display unfolding of GQ and binding of RPA to the unfolded ssTEL4. All GQ molecules are unfolded at 10 nM RPA. (B) Langmuir binding isotherm analysis (red curve) of RPA-mediated unfolding for the RPA-only case. (C) Unfolding of GQ and binding of RPA to the unfolded ssDNA in the presence of 200 nM POT1. All GQ molecules are unfolded at 10 nM RPA. (D) Langmuir binding isotherm analysis (red curve) of RPA-mediated unfolding in the presence of 200 nM POT1. The difference between α and Keq values obtained from the fit to those obtained in the RPA-only case is within the experimental error, suggesting that the GQ is not protected by POT1 in 150 mM Na+.

