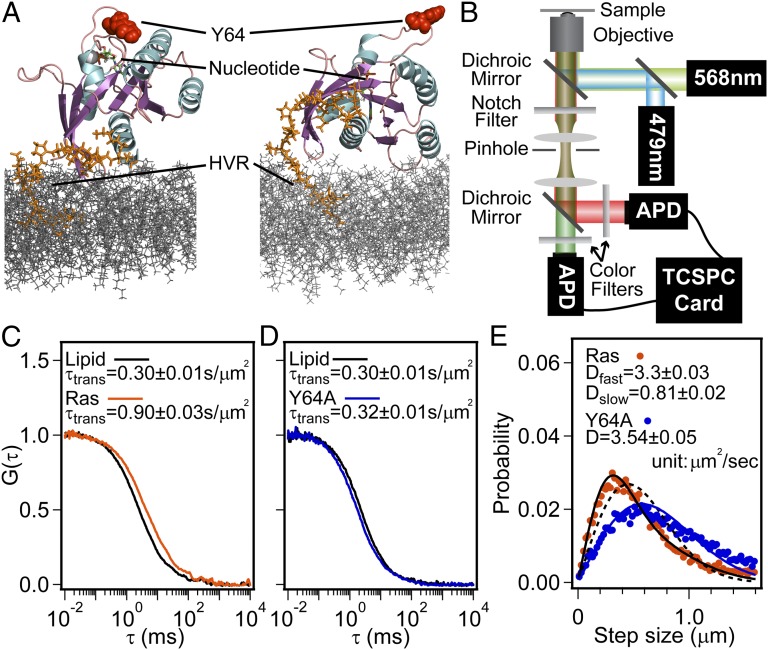
Fig. 1.
Lateral diffusion of H-Ras on membranes. (A) Two possible H-Ras orientations when tethered onto a lipid membrane (modified from ref. 18). The secondary structure of H-Ras G-domain (aa 1–166) is shown in cartoon mode. The portion of HVR (aa 167–184) used in the present work is in orange just above the top leaflet of the bilayer (gray). The lipid anchor, MCC-DOPE, is not included. (B) Schematic of two-color FCS setup. (C) Normalized auto-correlation functions, G(τ), of Ras(C181)-GDP and TR lipid at an H-Ras surface density of 312 molecules/μm2. The diffusion time constants, τtrans, are normalized to the detection area. The calculated diffusion coefficients are 3.39 ± 0.15 μm2/s and 1.12 ± 0.04 μm2/s for lipid and H-Ras, respectively. (D) G(τ) of Ras(Y64A,C181)-GDP and TR lipid at a Ras(Y64A,C181) surface density of 293 molecules/μm2 with a calculated D of 3.39 ± 0.05 μm2/s and 3.16 ± 0.07 μm2/s, respectively. (E) Diffusion step-size histogram from SMT analysis (circles) with Ds obtained by fitting data into a solution of the Einstein diffusion equation (lines). For H-Ras, a two-component model (solid black line) and a single-component model (dashed black line) are shown.

