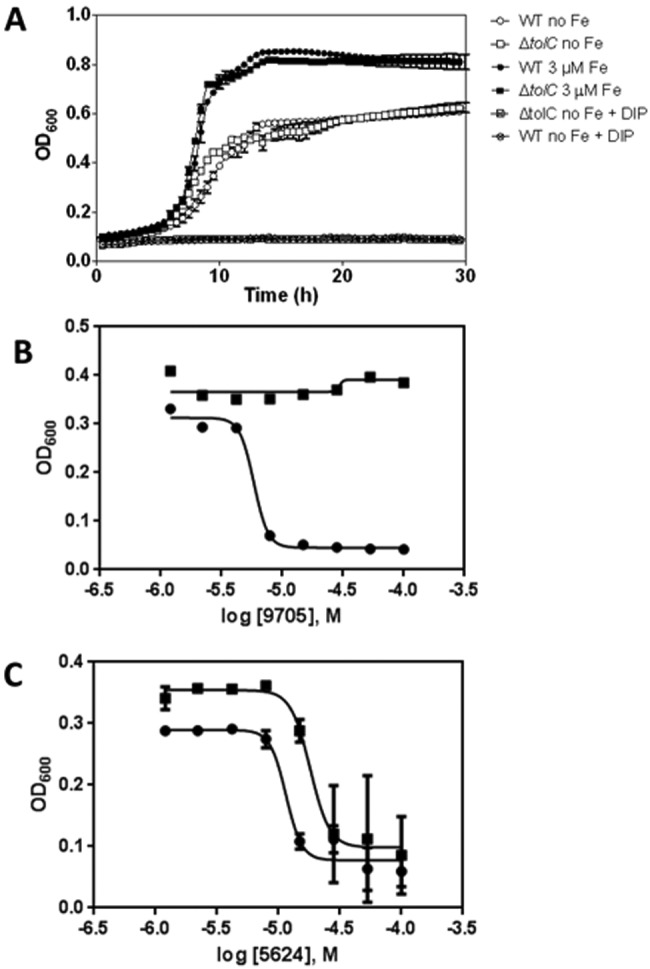
FIG 2 .

Growth curves of strain CFT073 ΔtolC::kan and representative dose-response curves of compounds confirmed by secondary assays. (A) Growth curves of E. coli CFT073 wild type and the ΔtolC mutant under different iron conditions. MOPS no iron was inoculated as described. “DIP” indicates addition of 200 µM dipyridyl to MOPS no iron. CFT073 ΔtolC::kan grows similarly to the WT under all iron conditions tested. Curves are means ± SD for 5 replicates. (B and C) Representative plots of dose-response curves (377 compounds tested; see attrition rates in Fig. S5 in the supplemental material) using strain CFT073 ΔtolC::kan. Plots were fit by nonlinear regression for sigmoidal kinetics. Each compound was confirmed in replicates (n = 4). The assay readout was optical density at 600 nm after a 16-h incubation in MOPS no iron (circles) or MOPS plus 3 µM FeSO4 (squares). (B) Representative plots of a compound for which pAC50 (MOPS no iron) minus pAC50 (MOPS with 3 µM FeSO4) is >1. Compounds in this category were selected for fresh powder purchase and retested in quadruplicate. (C) Representative plot of a compound for which pAC50 (MOPS no iron) minus pAC50 (MOPS 3 µM FeSO4) is >1. Compounds in this category were removed from further consideration.
