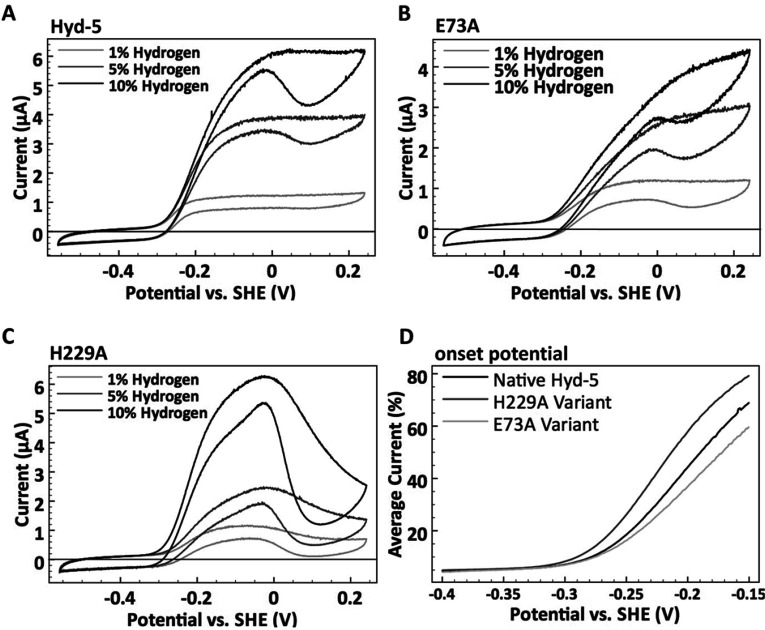
Figure 6. H2 oxidation electrocatalysis.
Comparing the catalytic response to H2 of (A) native S. enterica Hyd-5 and the (B) E73A and (C) H229A variants at pH 6.0, 37°C. Cyclic voltammograms were performed under different percentages of H2 as indicated. A N2 carrier gas was used to give a total gas mixture flow rate of 100 scc/min. The potential was increased from −0.56 to +0.24 V compared with the SHE, and then the scan direction was reversed all at a rate of 5 mV/s. The electrode was rotated at 4000 rev./min in all experiments. (D) To emphasize differences in catalytic onset potentials the voltammograms measured at 10% H2 for each enzyme are compared. The current during the forward and back potential sweep has been averaged and then normalized relative to the current at 0 V compared with the SHE.

